A. н к Standard ID mg N per L Abs Sample ID Upslope Absorbance Dilution mg N/L Upslope Downslope Absorbance Dillution mg N/L Downslope Std 0 0.5 0.01 0.2 0.5 Std 0.1 4. 0.1 0.12 0.5 0.01 0.251 0.5 Std 0.2 0.2 0.225 0.395 0.01 0.951 Std 0.4 0.4 0.432 0.332 0.1 0.2 Std 0.6 0.5 0.585 0.551 0.01 0.149 0.556 0.01 0.2 0.5 0.359 0.02 0.251 10 0.331 0.01 0.2 11 0.363 0.01 0.951 0.5 12 10 0.244 0.02 0.159 13 11 0.375 0.01 0.2 0.5 14 12 0.5 0.02 0.143 0.5 15 13 0.541 0.1 0.317 16 14 0.669 0.01 0.563 17 15 0.328 0.1 0.925 0.5 18 16 0.417 0.01 0.563 19 17 0.449 0.02 0.653 18 0.5 0.01 0.915 0.5 21 19 0.642 0.1 0.167 22 20 0.5 0.01 0.148 1. 23 21 0.243 0.1 0.851 0.5 24 22 0.375 0.01 0.536 1 25 23 0.5 0.02 0.941 0.5 26 24 0.868 0.1 0.159 0.5 27 25 0.119 0.01 0.897 0.5 28 26 0.459 0.01 0.316 0.5 29 27 0.532 0.02 0.313 0.5 30 28 0.686 0.01 0.458 31 29 0.5 0.02 0.331 0.5 32 30 0.206 0.01 0.797


Inverse Normal Distribution
The method used for finding the corresponding z-critical value in a normal distribution using the known probability is said to be an inverse normal distribution. The inverse normal distribution is a continuous probability distribution with a family of two parameters.
Mean, Median, Mode
It is a descriptive summary of a data set. It can be defined by using some of the measures. The central tendencies do not provide information regarding individual data from the dataset. However, they give a summary of the data set. The central tendency or measure of central tendency is a central or typical value for a probability distribution.
Z-Scores
A z-score is a unit of measurement used in statistics to describe the position of a raw score in terms of its distance from the mean, measured with reference to standard deviation from the mean. Z-scores are useful in statistics because they allow comparison between two scores that belong to different normal distributions.
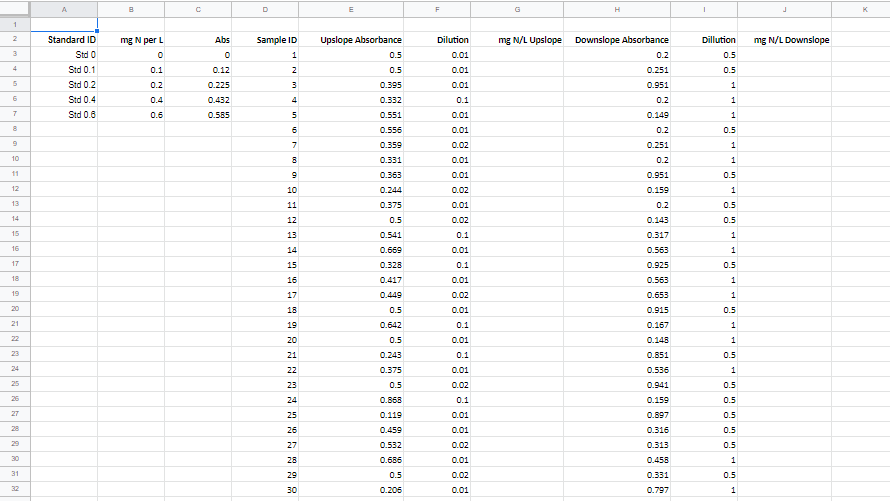
What is the average NO3- concentration at the upslope site (3 decimal places)?
What is the average NO3- concentration at the downslope site ( 3 decimal places)?
Given the EPA drinking water quality standard is 10 mg/L of nitrate, is the upslope site safe to drink based only on nitrate content? (Enter yes or no)
Is the downslope site safe to drink, based only on NO3- concentration? (Enter yes or no)
Assuming the two sites are hydrologically well connected, the transit time between the two sites is fast, and the two sites cannot be treated as independent samples, what kind of t-test should be performed to show that the upslope site is greater than the downslope site? Enter the letter of your answer choice in the answer blank
A. one-tailed unpaired t-test
B. two-tailed unpaired t-test
C. one-tailed paired t-test
D. two-tailed paired t-test
What is the calculated t statistic, rounded to 4 decimal places?
Is the calculated t statistic greater or less than the critical t value reported by the data analysis tool pack? (enter greater or less)
Is the nitrate concentration at the upslope site significantly greater than the downslope site? (Enteryes or no)
Based on this statistical result, and assuming no diffusion or dilution occurs between the upslope and downslope site, do you think microbes are removing NO3- from the ground water? (Enter yes or no)


Trending now
This is a popular solution!

Step by step
Solved in 2 steps with 6 images


