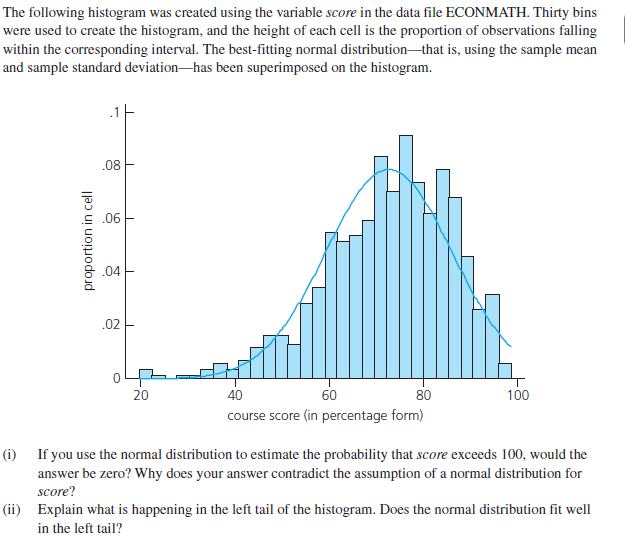
The following histogram was created using the variable score in the data file ECONMATH. Thirty bins were used to create the histogram, and the height of each cell is the proportion of observations falling within the corresponding interval. The best-fitting normal distribution-that is, using the sample mean and sample standard deviation-has been superimposed on the histogram. .08 .06 .04 .02 0모 20 40 60 100 course score (in percentage form) SC (i) If you use the normal distribution to estimate the probability that score exceeds 100, would the answer be zero? Why does your answer contradict the assumption of a normal distribution for score? (ii) Explain what is happening in the left tail of the histogram. Does the normal distribution fit well in the left tail? proportion in cell
The following histogram was created using the variable score in the data file ECONMATH. Thirty bins were used to create the histogram, and the height of each cell is the proportion of observations falling within the corresponding interval. The best-fitting normal distribution-that is, using the sample mean and sample standard deviation-has been superimposed on the histogram. .08 .06 .04 .02 0모 20 40 60 100 course score (in percentage form) SC (i) If you use the normal distribution to estimate the probability that score exceeds 100, would the answer be zero? Why does your answer contradict the assumption of a normal distribution for score? (ii) Explain what is happening in the left tail of the histogram. Does the normal distribution fit well in the left tail? proportion in cell

Glencoe Algebra 1, Student Edition, 9780079039897, 0079039898, 2018
18th Edition
ISBN:9780079039897
Author:Carter
Publisher:Carter
Chapter10: Statistics
Section10.4: Distributions Of Data
Problem 19PFA

Related questions
Question
Transcribed Image Text:The following histogram was created using the variable score in the data file ECONMATH. Thirty bins
were used to create the histogram, and the height of each cell is the proportion of observations falling
within the corresponding interval. The best-fitting normal distribution-that is, using the sample mean
and sample standard deviation-has been superimposed on the histogram.
.08
.06
.04
.02
0모
20
40
60
100
course score (in percentage form)
SC
(i) If you use the normal distribution to estimate the probability that score exceeds 100, would the
answer be zero? Why does your answer contradict the assumption of a normal distribution for
score?
(ii) Explain what is happening in the left tail of the histogram. Does the normal distribution fit well
in the left tail?
proportion in cell
Expert Solution
This question has been solved!
Explore an expertly crafted, step-by-step solution for a thorough understanding of key concepts.

This is a popular solution!

Trending now
This is a popular solution!

Step by step
Solved in 3 steps

Recommended textbooks for you
Glencoe Algebra 1, Student Edition, 9780079039897…
Algebra
ISBN:
9780079039897
Author:
Carter
Publisher:
McGraw Hill
Glencoe Algebra 1, Student Edition, 9780079039897…
Algebra
ISBN:
9780079039897
Author:
Carter
Publisher:
McGraw Hill