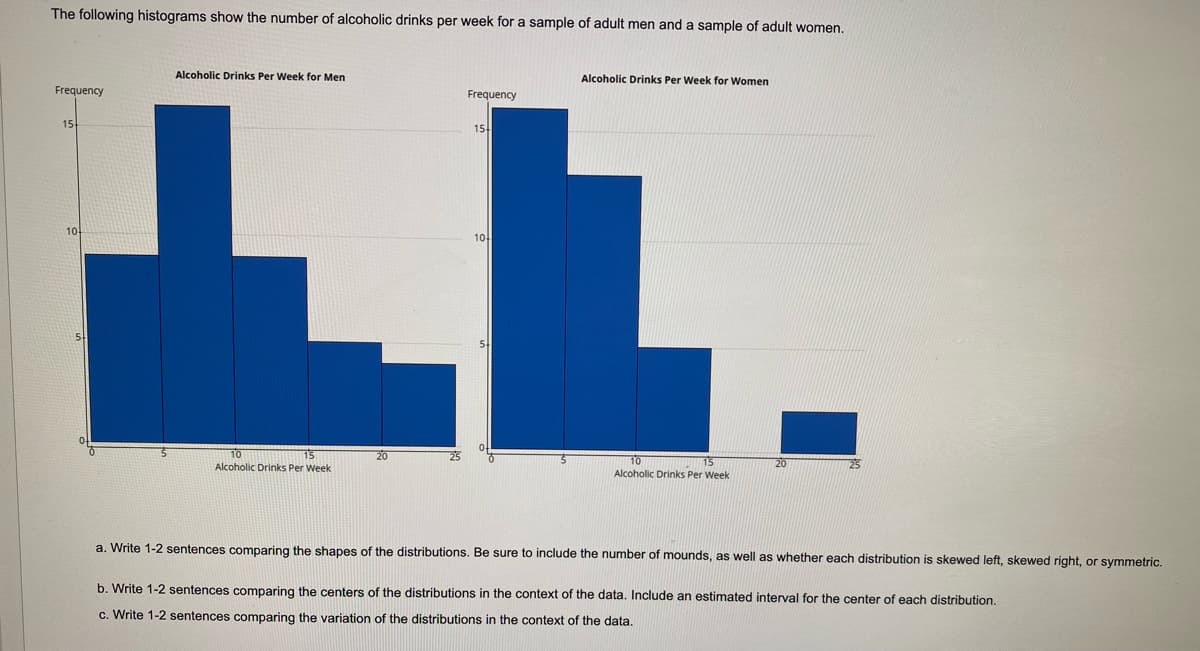
The following histograms show the number of alcoholic drinks per week for a sample of adult men and a sample of adult women.
Q: The following data give the speeds of 13 cars (in mph) measured by radar, travelling on l-84. 73 75…
A: Solution
Q: The following ten data values are provided: 3815 3083 1609 1566 1430 1428 1299 995 973 820 The 80th…
A: The number of observations is, n=9. 29) The data values are sorted in ascending order is, 820, 973,…
Q: The following histograms were derived using the same data on cycles to failure of aluminum test…
A: Histogram: Histogram is one of the popularly used graph for the representation of frequency…
Q: The following data are the monthly salaries and the grade point averages for students who obtained a…
A: Data Let X monthly salary and Y be the grade point average X=2.6,3.4,3.6,3.2,3.5,2.9…
Q: Calculate the mode of the following data
A: Mode: Mode is the most frequent occurrence in a data set.
Q: Find out by interpolation from the following data the number of workers earning $ 24 of more but…
A: Given: Earning less than ($) Number of workers 20 296 25 599 30 804 35 918 40 966
Q: The better-selling candies are often high in calories. Assume that the following data show the…
A: Given information: The data represents the calorie contents from the samples of M&M’s, Kit Kat…
Q: The manager of specialty outdoor store has gathered the following data concerning sales (in hundreds…
A: The correct option is A side -by-side bar chart for the dollars of sales on hardware for each of…
Q: Create a histogram for the following data: the number of books bought by 50 part-time college…
A: class will be calculated by (upper limit-lower limit)/2 on the basis of class interval the histogram…
Q: Following is the data of age of 50 CEO’s of companies. Give a detailed analysis of data.
A: Given α=15 Age 61 51 63 60 63 57 60 61 57 60 63 61 58 59 56 60…
Q: Give an interpretation for the following histogram.
A: Given The histogram is given below:
Q: The table to the right shows selected ages of licensed drivers in one country and the corresponding…
A: The objective is to find the percentage of drivers who are younger that 55. Given the percentile of…
Q: For the following ordered set of data, find the 60th percentile. 0, 2, 3, 5, 5, 6, 8, 10, 10, 11,…
A: Note: If "L" is a whole number then the value of the kth percentile is the midway between Lth value…
Q: What is the value of SP for the following set of data? 4 X 11 NN
A: SP means the sum of products.
Q: The following histograms were derived using the same data on cycles to failure of aluminum test…
A: From the given information, The histograms are given for the failure of aluminum test coupons. First…
Q: The following data give the speeds of 13 cars (in mph) measured by radar, travelling on I-84.…
A: The given data arranged in ascending order are: 68 68 69 69 72 72 73 74 75 76 77 78…
Q: The following is data for the first and second Quiz scores for 8 students in a class. First Quiz…
A: Output: Steps to construct scatter plot in Excel: Enter the data for Q1 and Q2 in Excel…
Q: = Find the class width for this histogram.
A: Here Given Histogram for the Exam score of Prealgebra Class... And Class width = Upper Limit -…
Q: Create a histogram using SPSS and the following data:
A:
Q: 3. Use the data set below to find the following: Data Frequency Item 30 35 40 45 8/279
A:
Q: The better-selling candies are often high in calories. Assume that the following data show the…
A: Given information: The data represents the calorie contents from the samples of M&M’s, Kit Kat…
Q: The following data represent the living situation of newlyweds in a large metropolitan area and…
A:
Q: The data provided in the above statkey display refers to a random sample of 50 healthy adults where…
A: a) From the output, For original sample, n=50 That is, the number of people in the original sample…
Q: The table to the right shows selected ages of licensed drivers in one country and the corresponding…
A: Given Information: The table shows selected ages of licensed drivers in one country and the…
Q: The following data provides the grades of 10 randomly selected engineering students on their…
A: Given : Data provides the grades of 10 randomly selected engineering students on their Statistics…
Q: At OC, students have been surveyed to see whether they attend orientation. The data is as follows:…
A: Woman Men Yes 162 112 No 148…
Q: Match each histogram to the boxplot that represents the same data set. (a) (b) (e) (d) (1) (2) (3)…
A: From the given plots, the shape of the histograms is given below: Histogram (a): Right skewed.…
Q: what is the value of SP for the following set of data? x y 1 4 2 4 9…
A: From the given information,
Q: The diastolic blood pressures, in mm Hg, for a sample of patients at a clinic are given. Create a…
A: There are 40 observations of diastolic blood pressures in mm Hg. So, n=40.
Q: The following data represent the boxplot and quartiles to decide if 0.89 0.90 0.93 0.94 0 93 0 92 0…
A: The correct answer is C. The following procedure is used to construct a box plot, Enter the data…
Q: The following data represents the number of home runs that Ryan Howard, a Major League Baseball…
A:
Q: In the pulse data, which of the following charts is MOST appropriate for the variable measuring…
A: Bar chart Bar chart is suitable when data is categorical. Frequency in a bar chart can be represent…
Q: The following histogram shows the number of items sold at a grocery store at various prices which of…
A: D). (2.50,2.51,5.00,5.01,7.51, 10.00)
Q: Data was collected for a sample of organic snacks. The amount of sugar (in mg) in each snack is…
A:
Q: Find out the combined mean for the following data. X1 X2 60 25 70 35 40 30 30
A:
Q: The following histogram shows the scores on the first exam for a statistics class. 12 50 60 70 80 90…
A: From the histogram, the class intervals are 50-60, 60-70, 70-80, 80-90, 90-100.
Q: The following data set outlines the scores students had on an Algebra test. 40 40 41 41 41 41 42 43…
A: What is frequency ? In statistics , the frequency of an event is the number of times an observation…
Q: Consider the following data on price ($) and the overall score for six stereo headphones tested by a…
A: Consider the following data on price ($) and the overall score for six stereo headphones tested by a…
Q: The table to the right shows selected ages of licensed drivers in one country and the corresponding…
A: From the table, the percentile corresponding to the age 35 is 39 indicating that there are 39% of…
Q: Jse the following histogram shows the final grades of a college algebra class for questions 19-21:…
A: It is an important part of statistics . It is widely used .
Q: The data below are the final exam scores of 10 randomly selected history students and the number of…
A: total student 10
Q: The following summary data relate to the adult population of a small village: Adult population 600…
A:
Q: A study was done to look at the relationship between number of movies people watch at the theater…
A:
Q: The following data give the speeds of 13 cars (in mph) measured by radar, travelling on l-84. 73 75…
A: Calculate Percentiles-35 from the following data73,75,69,68,78,69,74,76,72,79,68,77,70
Q: The following histogram shows the scores on the first Statistics exam in Ms. Cora Tan's class. How…
A: Solution
Q: Find the range of the following data set: 5, 34, 27, 8, 9, 45, 67, 22, 3, 93, 81 93 O 5 O 80 O 90 O…
A: Range = largest value - lowest value
Q: For the following data. The 25th percentile is 16, 25, 4, 18, 11, 13, 20, 8,11, 9 اختر احدى الدجابات…
A: We have given that, The data set is, 16, 25, 4, 18, 11, 13, 20, 8, 11, 9 Then, We will find the…
Q: The following data represent the soc psychological test. (The higher the score 9 14
A: To construct boxplot we need five number summary.
Q: 3. Using the following informal histogram, calculate each of the following. 5 4. 3. 4 2.
A: From the provided histogram we have the probability distribution as, Xi fi 1 1 2 3…
Trending now
This is a popular solution!
Step by step
Solved in 4 steps