The following is a histogram showing the distribution pe caused by tornadoes, over the period 1950 to 1999, in e data are in millions of dollars, and the class intervals are Average Tomado Damage for the 50 States ane
The following is a histogram showing the distribution pe caused by tornadoes, over the period 1950 to 1999, in e data are in millions of dollars, and the class intervals are Average Tomado Damage for the 50 States ane

Glencoe Algebra 1, Student Edition, 9780079039897, 0079039898, 2018
18th Edition
ISBN:9780079039897
Author:Carter
Publisher:Carter
Chapter10: Statistics
Section10.4: Distributions Of Data
Problem 19PFA

Related questions

Question
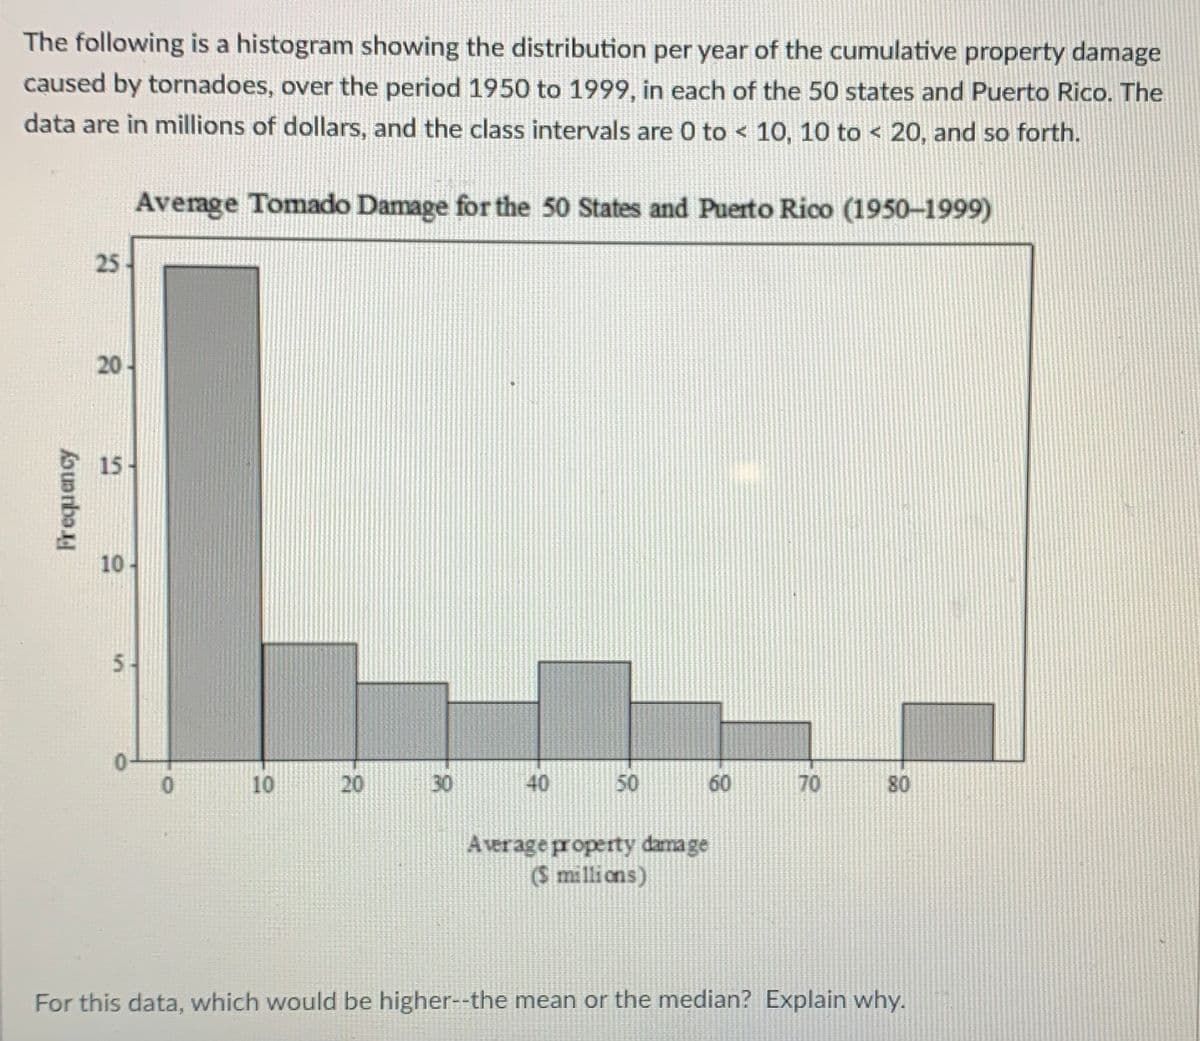
Transcribed Image Text:The following is a histogram showing the distribution per year of the cumulative property damage
caused by tornadoes, over the period 1950 to 1999, in each of the 50 states and Puerto Rico. The
data are in millions of dollars, and the class intervals are 0 to < 10, 10 to < 20, and so forth.
Average Tomado Damage for the 50 States and Puerto Rico (1950-1999)
25
20
15
10-
5-
10
20
30
40
50
60
70
80
Average property dama ge
S millions)
For this data, which would be higher--the mean or the median? Explain why.
Frequency
Expert Solution
This question has been solved!
Explore an expertly crafted, step-by-step solution for a thorough understanding of key concepts.

This is a popular solution!

Trending now
This is a popular solution!

Step by step
Solved in 2 steps

Knowledge Booster


Learn more about
Need a deep-dive on the concept behind this application? Look no further. Learn more about this topic, statistics and related others by exploring similar questions and additional content below.Recommended textbooks for you
Glencoe Algebra 1, Student Edition, 9780079039897…
Algebra
ISBN:
9780079039897
Author:
Carter
Publisher:
McGraw Hill
Glencoe Algebra 1, Student Edition, 9780079039897…
Algebra
ISBN:
9780079039897
Author:
Carter
Publisher:
McGraw Hill