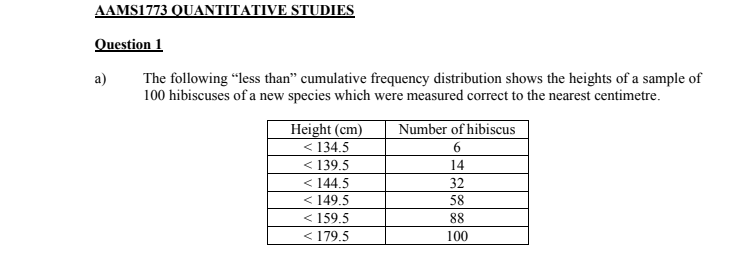
The following “less than" cumulative frequency distribution shows the heights of a sample of 100 hibiscuses of a new species which were measured correct to the nearest centimetre. a) Height (cm) < 134.5 < 139.5 < 144.5 < 149.5 < 159.5 < 179,5 Number of hibiscus 14 32 58 88 100
Q: (b) Which of the following is the correct histogram for this data? 8. 65 67 69 71 Height 73 75 4 2…
A: Formula : Relative frequency = Number of frequency/Total number of frequency
Q: Refer to the accompanying data set and use the 30 screw lengths to construct a frequency…
A: Observations in the ascending order are…
Q: A random sample of 30 male college students was selected, and their heights were measured. The…
A: Given the height of a random sample of 30 male college students as 67 66 69 74 66 67 72 69 68…
Q: Refer to the accompanying data set and use the 30 screw lengths to construct a frequency…
A: Given: Sample size n = 30 First lower class limit = 1.720 Class width = 0.010
Q: The following table summarizes the ages of a sample of 58 adults that are members of a certain…
A: Given, 58 ages of adults samples Freq. distribution table is Age Frequency 20-24 1 25-29 3…
Q: A random sample of 30 male college students was selected, and their heights were measured. The…
A: Number of times an observation repeats in the dataset is called its frequency. The relative…
Q: I am producing 400-gram loạf breads in one of my production lines and measured the weights of 28…
A: Hi! Thank you for the question, As per the honor code, we are allowed to answer three sub-parts at a…
Q: The following are the number of automobile accidents that occurred at 60 major intersections in a…
A: Automobile Accident Frequency 0 15 1 12 2 11 3 7 4 8 5 5 6 2
Q: A random sample of 30 male college students was selected, and their heights were measured. The…
A: Frequency: Number of times a particular value is repeated. Relative Frequency =Corresponding…
Q: Given the ungrouped frequency distribution, find the following statistic: mean. fi 126 75 4 18 T =…
A: We have given, Xi = 2 , 3 , 4 . Fi = 126 , 75 , 18 . We have to find Mean (xbar) = ?
Q: A random sample of 30 male college students was selected, and their heights were measured. The…
A: Frequency Distribution: In Statistical theory, a frequency distribution is a tabular, listed or…
Q: The following figures give the number of children born to 50 women: 3 2.11 5 4 3 3 4. 3 0 2 1 3 5 2…
A: The following data is given, 2 6 1 5 4 3 3 8 3 1 4 3 3 0 5 2 1 4 3 3 5 3 3 6 3 3 2 2 7 3 1…
Q: The following frequency distribution of weight in grams of mangos of a given variety is given below:…
A:
Q: If the values of the mean and standard deviation of the following frequency distribution (obtained…
A: Here given : Mean = 135.3 Standard deviation = 9.6 We have to calculate actual class intervals.
Q: For the following frequency distribution, how many individual scores are in the entire set? f 4 3 1…
A: The objective to find, total number of individual scores in the entire set. Let N be the total…
Q: Refer to the accompanying data set and use the 30 screw lengths to construct a frequency…
A: Selection of number of classes: The “2 to the k rule” suggests that the number of classes is the…
Q: Each observation in a random sample of 97 bicycle accidents resulting in death was classified…
A: It is needed to test, whether the proportion of accidents is not the same for all days of the week.
Q: Refer to the accompanying data set and use the 30 screw lengths to construct a frequency…
A: There are 30 data in the data set. The minimum value is 3.722 (consider it as 3.720 as the lower…
Q: Given the following I.Q. scores of 40 job applicants to a company. 84 100 96 91 94 102 100 90 87 97…
A: Frequency of an observation gives the number of times the observation is repeated in the dataset. So…
Q: to the accompanying data set and use the 25 home voltage measurements to construct a frequency…
A: no. of classes =5 Range=127.7-126.8 =0.9 =0.9/5=0.18~0.2
Q: 2. To study the library habits of students at a local college, thirty randomly selected students…
A: Explanation To study the library habits of students at a local collage , thirty randomly selected…
Q: Complete the given relative frequency distribution and compute the stated relative frequencies.
A:
Q: Refer to the accompanying data set and use the 30 screw lengths to construct a frequency…
A: Step 1: The lowest value in the data set is 1.476. The highest value in the data set is 1.517. Step…
Q: If the following grouped frequency distribution table pertaining to a continuous variable were shown…
A:
Q: Screw Lengths (inches) 1.255 1.266 1.265 1.234 1.241 1.247 1.221 1.258 1.255 1.263 1.252 1.242 1.246…
A: The provided data set is: 1.263 1.255 1.266 1.265 1.234 1.241 1.247 1.221 1.258 1.255 1.252…
Q: The last digit of the heights of 39 statistics students were obtained as part of an experiment…
A: Given that there are total 39 student & Maximum range of frequency is 5 & Total Digits are…
Q: Consider the following set of times, measured in 1/100ths of a second: 62 65 71 72 73 75…
A: 1) Arrange the given data in ascending order: 62, 65, 65, 65, 70, 70, 71, 72, 72, 72, 72, 73, 73,…
Q: A random sample of 30 male college students was selected, and their heights were measured. The…
A: The frequency can be explained as the number of times a certain observation is observed to be…
Q: The following data represent the IQs of 50 police applicants who passed the 1st screening test.…
A: Procedure to obtain frequency distribution table using Excel: Enter the data in an excel sheet.…
Q: Refer to the accompanying data set and use the 30 screw lengths to construct a frequency…
A: Frequency distribution: The number of values lying in the particular interval or the number of times…
Q: A biologist measured the lengths of hundreds of cuckoo bird eggs. Use the relative frequency…
A: From the given table total percentage of X is 100
Q: Given the following frequency distribution, calculate the relative frequency of Red. Color of m&m's…
A:
Q: A random sample of 30 male college students was selected, and their heights were measured. The…
A: Given that. Make a frequency distribution table with the help of given data. Total sample (n) =…
Q: (i) Tabulate the marks as a frequency distribution grouping in interval of 10 marks, namely 0–9,…
A: Answer:
Q: Refer to the accompanying data set and use the 25 home voltage measurements to construct a frequency…
A: Frequency Distribution The number of occasions a measure did appear in a data source is its…
Q: If the prices of 500 pieces of jewelry (in peso and in centavo) are such lowest is 435.00 and the…
A: In this case, the minimum value is 435 and the maximum value is 95,795. Hence, the range is n =…
Q: In the following table the weights of 40 male students at State University are recorded to the…
A:
Q: Consider the following set of times, measured in 1/100ths of a second: 62 65 71 72 73 75…
A: Given : 62 65 71 72 73 75 76 77 79 80 65 70 72 72 74 75 76…
Q: The following data are the scores of 40 BS Biology students who took up the NMAT that was given last…
A: Introduction: The total number of observations is, n = 40. It is required to construct a frequency…
Q: Refer to the accompanying data set and use the 30 screw lengths to construct a frequency…
A: Length frequency 1.470-1.479 1 1.480-1.489 4 1.490-1.499 12 1.500-1.509 10 1.510-1.519 3…
Q: Consider the following frequency distribution: SOLVE AN Class Interval 10-under 20 20-under 30…
A: Frequency Distribution: A frequency distribution is representations of data in a graphical or…
Q: The scores that golfers shot on 18 holes at a local course were tabulated. The results are shown in…
A:
Q: The following is the frequency distribution of the sample weight from field of chickens in grams,…
A: The given data is, weight No. of chickens 720-700 10 700-680 20 680-660 25 660-640 20…
Q: Let the following figure display the relative frequency histogram of an equal-width frequency…
A:
Q: A distribution of numbers Is given by the following frequency nistogram.
A: The given diagram shows a negatively skewed distribution (histogram). Negatively skewed distribution…
Q: The following data give the time (in minutes) taken to commute from home to work for nurses. 10 50…
A: The two endpoints of a class interval used for tally marking are called the class limits. These…
Q: A grouped frequency distribution has been obtained for the number of personnel working in 100…
A: Given,The no.of personnel working in 100 workplacesand X=48.98
Q: Calculate the coefficient of skewness of the following frequency Distributions, given their…
A: The coefficient of skewness measures the skewness of distribution. The negative value of coefficient…
Question
Calculate the
Trending now
This is a popular solution!
Step by step
Solved in 3 steps with 1 images