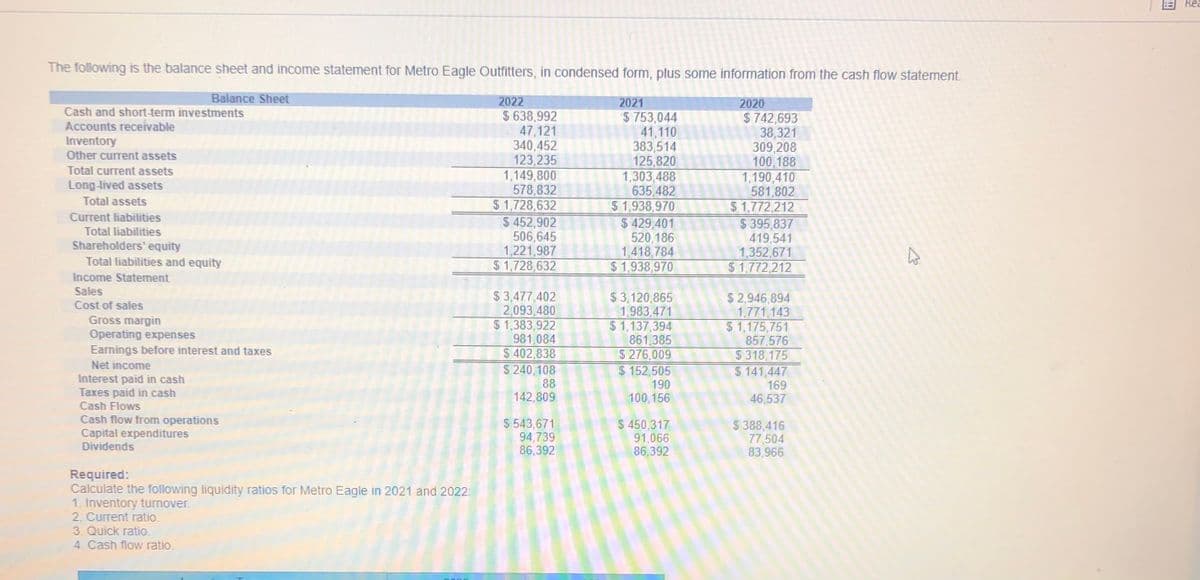
The following is the balance sheet and income statement for Metro Eagle Outfitters, in condensed form, plus some information from the cash flow statement Balance Sheet 2022 2021 $ 753,044 41,110 383,514 125,820 1,303,488 635,482 51.938.970 $ 429,401 520,186 1,418,784 $1.938,970 2020 $742,693 38,321 309,208 100,188 1,190,410 581,802 $1,772,212 $ 395,837 419.541 1,352,671 $1.772.212 Cash and short-term investments Accounts receivable Inventory $ 638,992 47,121 340,452 123.235 1,149,800 578,832 $1,728,632 $ 452,902 506,645 1,221,987 $1,728 632 Other current assets Total current assets Long-lived assets Total assets Current liabilities Total liabilities Shareholders' equity Total liabilities and equity Income Statement Sales Cost of sales Gross margin Operating expenses Eamings before interest and taxes Net income Interest paid in cash Taxes paid in cash Cash Flows $ 3,477,402 2,093 480 $1,383,922 981,084 $ 402,838 $ 240,108 88 142,809 $3,120,865 1,983.471 $1,137,394 861,385 $ 276.009 $152,505 $ 2,946,894 1.771 143 $1,175,751 857 576 $318.175 $ 141,447 169 46,537 190 100,156 Cash flow from operations Capital expenditures Dividends $ 543,671 94,739 86,392 $ 450,317 91,066 86,392 5 388,416 77.504 83,966 Required: Calculate the following liquidity ratios for Metro Eagle in 2021 and 2022: 1. Inventory turnover 2. Current ratio. 3. Quick ratio. 4. Cash flow ratio.


Reporting Cash Flows
Reporting of cash flows means a statement of cash flow which is a financial statement. A cash flow statement is prepared by gathering all the data regarding inflows and outflows of a company. The cash flow statement includes cash inflows and outflows from various activities such as operating, financing, and investment. Reporting this statement is important because it is the main financial statement of the company.
Balance Sheet
A balance sheet is an integral part of the set of financial statements of an organization that reports the assets, liabilities, equity (shareholding) capital, other short and long-term debts, along with other related items. A balance sheet is one of the most critical measures of the financial performance and position of the company, and as the name suggests, the statement must balance the assets against the liabilities and equity. The assets are what the company owns, and the liabilities represent what the company owes. Equity represents the amount invested in the business, either by the promoters of the company or by external shareholders. The total assets must match total liabilities plus equity.
Financial Statements
Financial statements are written records of an organization which provide a true and real picture of business activities. It shows the financial position and the operating performance of the company. It is prepared at the end of every financial cycle. It includes three main components that are balance sheet, income statement and cash flow statement.
Owner's Capital
Before we begin to understand what Owner’s capital is and what Equity financing is to an organization, it is important to understand some basic accounting terminologies. A double-entry bookkeeping system Normal account balances are those which are expected to have either a debit balance or a credit balance, depending on the nature of the account. An asset account will have a debit balance as normal balance because an asset is a debit account. Similarly, a liability account will have the normal balance as a credit balance because it is amount owed, representing a credit account. Equity is also said to have a credit balance as its normal balance. However, sometimes the normal balances may be reversed, often due to incorrect journal or posting entries or other accounting/ clerical errors.


Trending now
This is a popular solution!

Step by step
Solved in 2 steps


