The following is the distribution of the readings obtained with a Geiger counter of the number of particles emitted by a radioactive substance in 100 successive 40-second intervals: Number of 5-9 10-14 15-19 20-24 25-29 30-34 35-39 particles frequencies 1 10 37 36 13 Find the sample mean and sample standard deviation Find the probabilities that a random variable having a normal distribution with population mean and standard deviation as in (a) above will take on values in the table above Find the expected normal curve frequencies for the various classes a. b. C. mov be Jooked
The following is the distribution of the readings obtained with a Geiger counter of the number of particles emitted by a radioactive substance in 100 successive 40-second intervals: Number of 5-9 10-14 15-19 20-24 25-29 30-34 35-39 particles frequencies 1 10 37 36 13 Find the sample mean and sample standard deviation Find the probabilities that a random variable having a normal distribution with population mean and standard deviation as in (a) above will take on values in the table above Find the expected normal curve frequencies for the various classes a. b. C. mov be Jooked

MATLAB: An Introduction with Applications
6th Edition
ISBN:9781119256830
Author:Amos Gilat
Publisher:Amos Gilat
Chapter1: Starting With Matlab
Section: Chapter Questions
Problem 1P

Related questions
Question
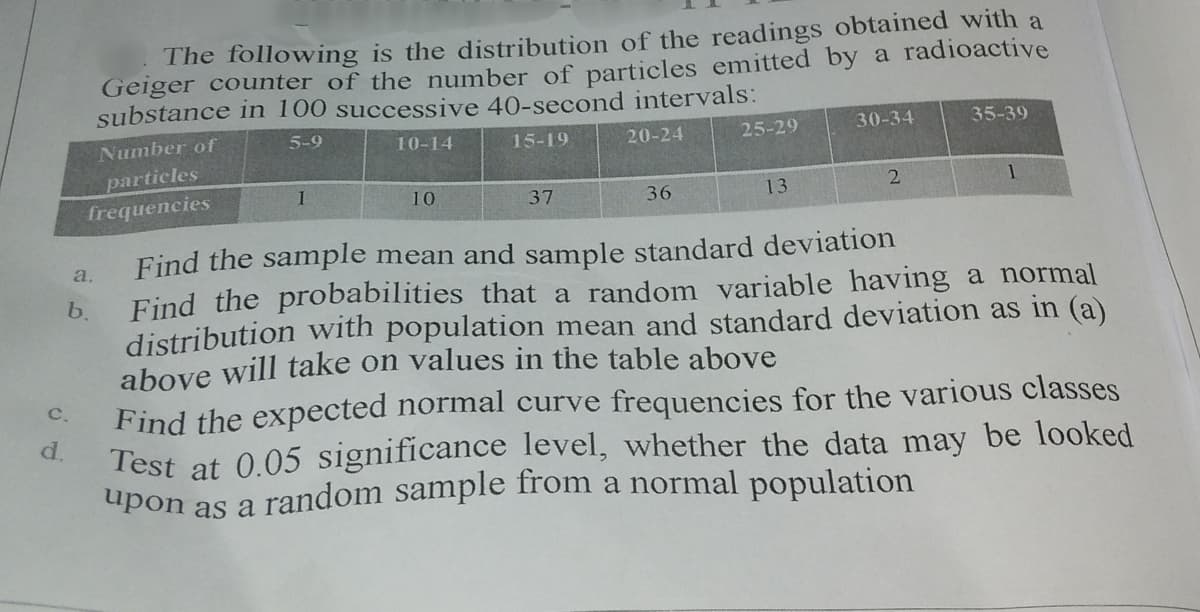
Transcribed Image Text:The following is the distribution of the readings obtained with a
Geiger counter of the number of particles emitted by a radioactive
substance in 100 successive 40-second intervals:
Number of
5-9
10-14
15-19
20-24
25-29
30-34
35-39
particles
frequencies
1
10
37
36
13
2.
Find the sample mean and sample standard deviation
a.
Find the probabilities that a random variable having a normal
distribution with population mean and standard deviation as in (a)
above will take on values in the table above
b.
Find the expected normal curve frequencies for the various classes
Test at 0.05 significance level, whether the data may be looked
d.
C.
Expert Solution
This question has been solved!
Explore an expertly crafted, step-by-step solution for a thorough understanding of key concepts.

This is a popular solution!

Trending now
This is a popular solution!

Step by step
Solved in 4 steps with 19 images

Recommended textbooks for you
MATLAB: An Introduction with Applications
Statistics
ISBN:
9781119256830
Author:
Amos Gilat
Publisher:
John Wiley & Sons Inc

Probability and Statistics for Engineering and th…
Statistics
ISBN:
9781305251809
Author:
Jay L. Devore
Publisher:
Cengage Learning

Statistics for The Behavioral Sciences (MindTap C…
Statistics
ISBN:
9781305504912
Author:
Frederick J Gravetter, Larry B. Wallnau
Publisher:
Cengage Learning
MATLAB: An Introduction with Applications
Statistics
ISBN:
9781119256830
Author:
Amos Gilat
Publisher:
John Wiley & Sons Inc
Probability and Statistics for Engineering and th…
Statistics
ISBN:
9781305251809
Author:
Jay L. Devore
Publisher:
Cengage Learning
Statistics for The Behavioral Sciences (MindTap C…
Statistics
ISBN:
9781305504912
Author:
Frederick J Gravetter, Larry B. Wallnau
Publisher:
Cengage Learning

Elementary Statistics: Picturing the World (7th E…
Statistics
ISBN:
9780134683416
Author:
Ron Larson, Betsy Farber
Publisher:
PEARSON

The Basic Practice of Statistics
Statistics
ISBN:
9781319042578
Author:
David S. Moore, William I. Notz, Michael A. Fligner
Publisher:
W. H. Freeman

Introduction to the Practice of Statistics
Statistics
ISBN:
9781319013387
Author:
David S. Moore, George P. McCabe, Bruce A. Craig
Publisher:
W. H. Freeman