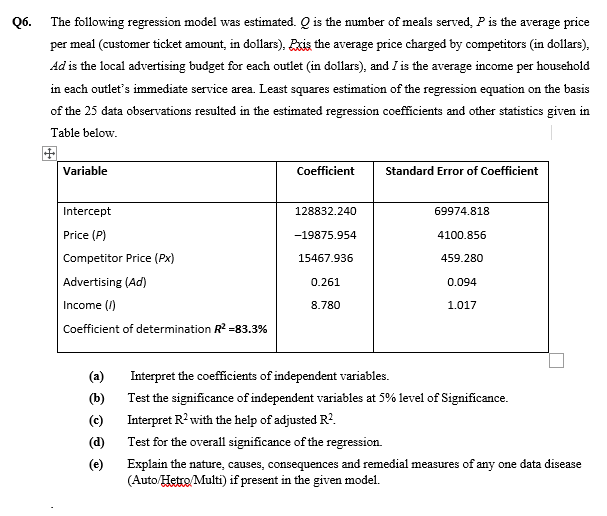
The following regression model was estimated. Q is the number of meals served, P is the average price per meal (customer ticket amount, in dollars), Rxis the average price charged by competitors (in dollars), Ad is the local advertising budget for each outlet (in dollars), and I is the average income per household in each outlet's immediate service area. Least squares estimation of the regression equation on the basis of the 25 data observations resulted in the estimated regression coefficients and other statistics given in Table below. Variable Coefficient Standard Error of Coefficient Intercept 128832.240 69974.818 Price (P) Competitor Price (Px) | Advertising (Ad) Income () -19875.954 4100.856 15467.936 459.280 0.261 0.094 8.780 1.017 Coefficient of determination R =83.3% (a) Interpret the coefficients of independent variables. (b) Test the significance of independent variables at 5% level of Significance. (c) Interpret R? with the help of adjusted R2. (d) Test for the overall significance of the regression. (e) Explain the nature, causes, consequences and remedial measures of any one data disease (Auto Hetro Multi) if present in the given model.


Correlation
Correlation defines a relationship between two independent variables. It tells the degree to which variables move in relation to each other. When two sets of data are related to each other, there is a correlation between them.
Linear Correlation
A correlation is used to determine the relationships between numerical and categorical variables. In other words, it is an indicator of how things are connected to one another. The correlation analysis is the study of how variables are related.
Regression Analysis
Regression analysis is a statistical method in which it estimates the relationship between a dependent variable and one or more independent variable. In simple terms dependent variable is called as outcome variable and independent variable is called as predictors. Regression analysis is one of the methods to find the trends in data. The independent variable used in Regression analysis is named Predictor variable. It offers data of an associated dependent variable regarding a particular outcome.


Trending now
This is a popular solution!

Step by step
Solved in 3 steps with 1 images


