The following results are an autoregression for US Exports to Mexico where the dependent variable is the lagged value of US Exports. a) Fill in the table b)Based on these regression results, what is your forecast of US Exports to Mexico for March 2005? c) Which of the two forecasts do you think is more accurate? Explai
The following results are an autoregression for US Exports to Mexico where the dependent variable is the lagged value of US Exports. a) Fill in the table b)Based on these regression results, what is your forecast of US Exports to Mexico for March 2005? c) Which of the two forecasts do you think is more accurate? Explai

MATLAB: An Introduction with Applications
6th Edition
ISBN:9781119256830
Author:Amos Gilat
Publisher:Amos Gilat
Chapter1: Starting With Matlab
Section: Chapter Questions
Problem 1P

Related questions
Question
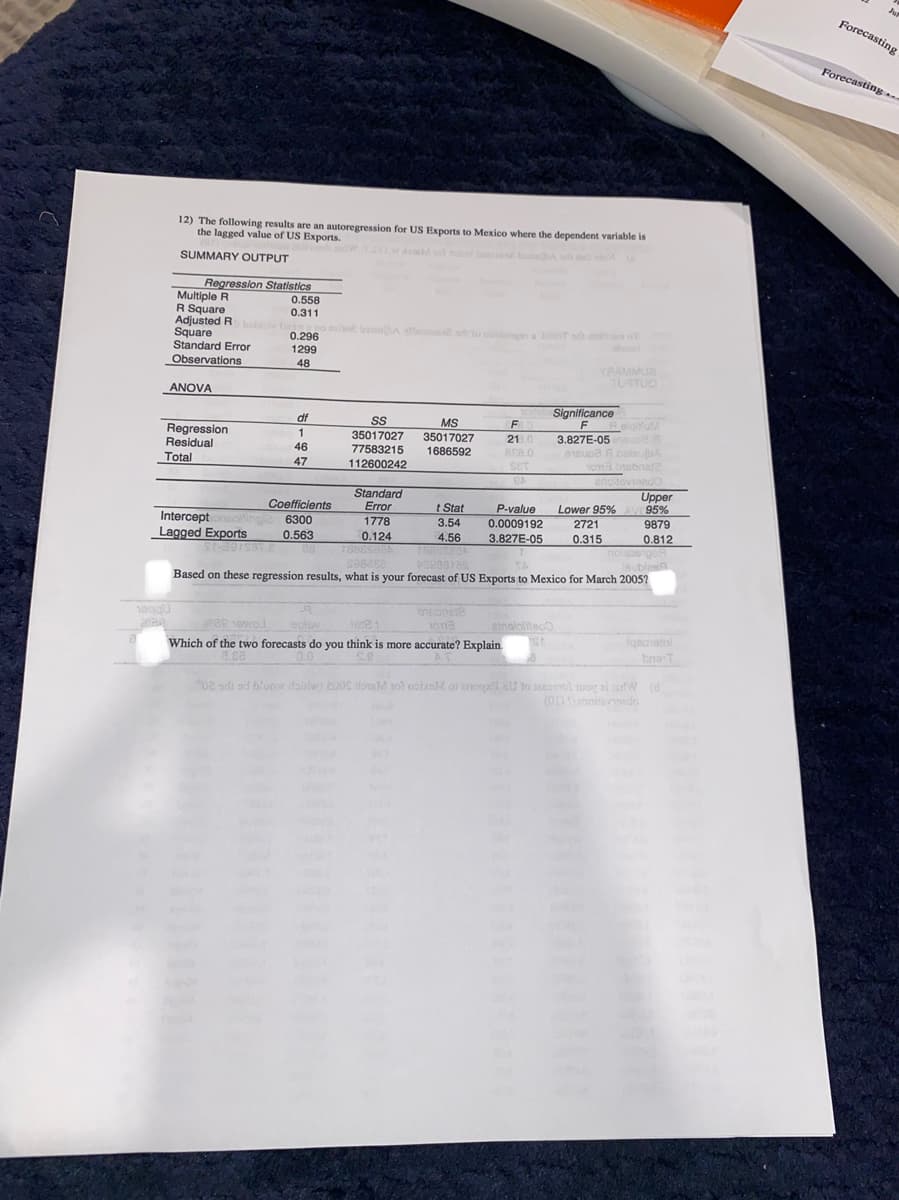
12) The following results are an autoregression for US Exports to Mexico where the dependent variable is the lagged value of US Exports.
a) Fill in the table
b)Based on these regression results, what is your forecast of US Exports to Mexico for March 2005?
c) Which of the two forecasts do you think is more accurate? Explain.
Transcribed Image Text:Forecasting
Forecasting..
12) The following results are an autoregression for US Exports to Mexico where the dependent variable is
the lagged value of US Exports.
LN ld bo A
SUMMARY OUTPUT
Regression Statistics
Multiple R
R Square
Adjusted R lt
Square
Standard Error
Observations
0.558
0.311
o o b A ee o lo o t
0.296
1299
48
YRAMMUS
TUSTUO
ANOVA
Significance
df
MS
Regression
Residual
Total
F
210
BE8.0
FRelotu
3.827E-05aupe a
eupe A bolmubA
Yona bsbnat2
enotovieedO
35017027
77583215
35017027
46
1686592
47
112600242
SET
Standard
Error
1778
0.124
Upper
Lower 95%AV 95%
9879
0.812
Coefficients
t Stat
P-value
Interceptnoigle 6300
Lagged Exports
3.54
0.0009192
2721
0.563
4.56
3.827E-05
0.315
1888S08A
1888S8
esasa
ublass
Based on these regression results, what is your forecast of US Exports to Mexico for March 2005?
bnebneta
rae 1owo
ainololiteo
fgeavatnl
bna T
Which of the two forecasts do you think is more accurate? Explain.
a.ca
0.0
se
0 d bluow doirlw) c00s donM 1o) ootzaM ol nog 2U to aool oy ai rfW (d
(on moi do
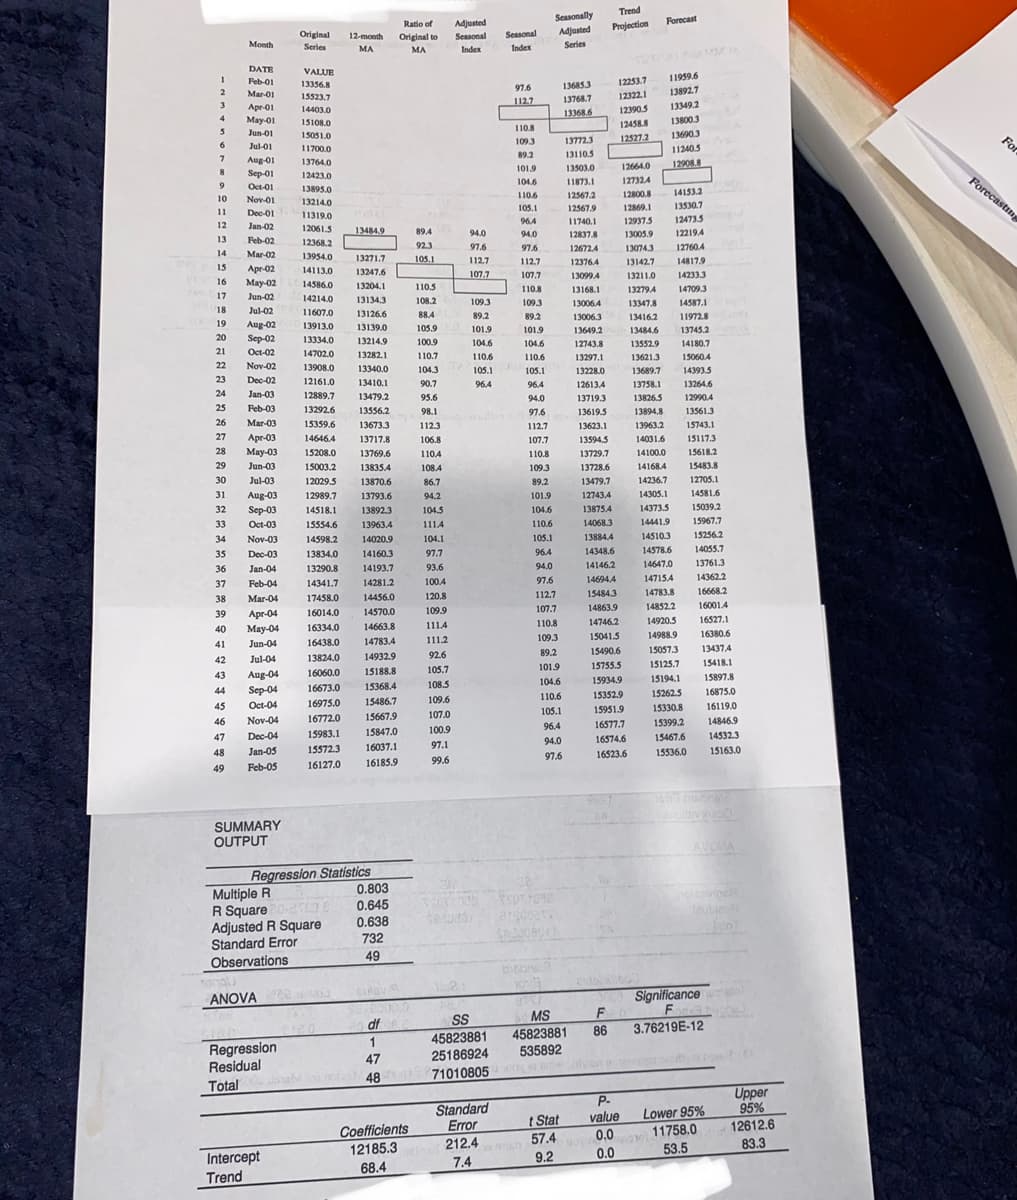
Transcribed Image Text:Trend
Seasonally
Adjusted
Ratio of
Adjusted
Forecast
Original
Projection
12-month
Original to
Seasonal
Seasonal
Month
Series
MA
MA
Index
Index
Series
DATE
VALUE
Feb-01
Mar-01
13356.8
11959.6
97.6
136853
12253.7
15523.7
12322.1
13892.7
3
112.7
13768.7
Apr-01
May-01
14403.0
12390.5
13349.2
15108.0
13368.6
124588
13800.3
Jun-01
15051.0
110.8
6.
13772.3
12527.2
136903
Jul-01
11700.0
109.3
112405
Fof
Aug-01
13764.0
89.2
13110.5
Sep-01
12664.0
12908
12423.0
101.9
13503.0
9
Oct-01
13895.0
104.6
11873.1
127324
Forecasting
10
Nov-01
13214.0
110.6
12567.2
12800.8
14153.2
11
Dec-01
11319.0
105.1
12567.9
12869.1
135307
12
Jan-02
12061.5
13484.9
96.4
11740.1
12937.5
12473.5
13
Feb-02
89.4
94.0
94.0
12837.8
13005.9
122194
12368.2
14
Mar-02
92.3
97.6
97.6
12672.4
13074.3
12760.4
13954.0
13271.7
105.1
15
Apr-02
112.7
112.7
12376.4
13142.7
14817.9
14113.0
13247.6
16
Маy-02
107.7
107.7
13099.4
13211.0
14586.0
13204.1
14233.3
110.5
17
Jun-02
14214.0
110.8
13168.1
13279.4
14709.3
13134.3
108.2
18
Jul-02
109.3
109.3
13006.4
13347.8
14587.1
11607.0
13126.6
19
Aug-02
88.4
89.2
89.2
13006.3
11972.8
13416.2
13913.0
13139.0
20
Sep-02
105.9
101.9
101.9
13649.2
13334.0
13214.9
13484.6
13745.2
21
Oct-02
100.9
104.6
104.6
12743.8
13552.9
14180.7
14702.0
13282.1
22
Nov-02
110.7
110.6
110.6
13297.1
13621.3
15060.4
13908.0
13340.0
A105.1
23
Dec-02
104.3
105.1
13228.0
13689.7
14393.5
12161.0
13410.1
90.7
96.4
96.4
12613.4
13758.1
13264.6
24
Jan-03
12889.7
13479.2
95.6
94.0
13719.3
13826.5
12990.4
25
Feb-03
13292.6
13556.2
98.1
97.6
13619.5
13894.8
13561.3
26
Mar-03
15359.6
13673.3
112.3
112.7
13623.1
13963.2
15743.1
27
Apr-03
14646.4
13717.8
106.8
107.7
13594.5
14031.6
15117.3
28
Мay-03
15208.0
13769.6
110.4
110.8
13729.7
14100.0
15618.2
29
Jun-03
15003.2
13835.4
108.4
109.3
13728.6
14168.4
15483.8
30
Jul-03
12029.5
13870.6
86.7
89.2
13479.7
14236.7
12705.1
31
Aug-03
12989.7
13793.6
94.2
101.9
12743.4
14305.1
14581.6
32
Sep-03
Oct-03
14518.1
13892.3
104.5
104.6
13875.4
14373.5
15039.2
33
15554.6
13963.4
111.4
110.6
14068.3
14441.9
15967.7
34
Nov-03
14598.2
14020.9
104.1
105.1
13884.4
14510.3
15256.2
35
Dec-03
13834.0
14160.3
97.7
96.4
14348.6
14578.6
14055.7
36
Jan-04
13290.8
14193.7
93.6
94.0
14146.2
14647.0
13761.3
37
Feb-04
14341.7
14281.2
100.4
97.6
14694,4
14715.4
14362.2
38
Mar-04
17458.0
14456.0
120.8
112.7
15484.3
14783.8
16668.2
39
Apr-04
16014.0
14570.0
109.9
107.7
14863.9
14852.2
16001.4
40
Мay-04
16334.0
14663.8
111.4
110.8
14746.2
14920.5
16527.1
41
Jun-04
16438.0
14783.4
111.2
109.3
15041.5
14988.9
16380.6
42
Jul-04
13824.0
14932.9
92.6
89.2
15490.6
15057.3
13437.4
43
Аug-04
16060.0
15188.8
105.7
101.9
15755.5
15125.7
15418.1
16673.0
108.5
104.6
15934.9
15194.1
15897.8
Sep-04
Oct-04
44
15368.4
45
16975.0
15486.7
109.6
110.6
15352.9
15262.5
16875.0
Nov-04
16772.0
15667.9
107.0
105.1
15951.9
15330.8
16119.0
46
15983.1
15847.0
100.9
96.4
16577.7
15399.2
14846.9
47
Dec-04
Jan-05
16037.1
97.1
94.0
16574.6
15467.6
14532.3
48
15572.3
16185.9
99.6
97.6
16523.6
15536.0
15163.0
49
Feb-05
16127.0
SUMMARY
OUTPUT
AVOWA
Regression Statistics
Multiple R
R Square 3
Adjusted R Square
Standard Error
Observations
0.803
0,645
bie
e
0.638
732
to
49
Significance n
F
ANOVA
SS
45823881
25186924
71010805
MS
45823881
535892
df
86
3.76219E-12
1
Regression
Residual
Total
47
48
Standard
Error
212.4
P-
value
0.0
Lower 95%
11758.0
53.5
Upper
95%
12612.6
83.3
Coefficients
12185.3
t Stat
57.4
Intercept
9.2
0.0
68.4
7.4
Trend
Expert Solution
This question has been solved!
Explore an expertly crafted, step-by-step solution for a thorough understanding of key concepts.

This is a popular solution!

Trending now
This is a popular solution!

Step by step
Solved in 3 steps with 3 images

Recommended textbooks for you
MATLAB: An Introduction with Applications
Statistics
ISBN:
9781119256830
Author:
Amos Gilat
Publisher:
John Wiley & Sons Inc

Probability and Statistics for Engineering and th…
Statistics
ISBN:
9781305251809
Author:
Jay L. Devore
Publisher:
Cengage Learning

Statistics for The Behavioral Sciences (MindTap C…
Statistics
ISBN:
9781305504912
Author:
Frederick J Gravetter, Larry B. Wallnau
Publisher:
Cengage Learning
MATLAB: An Introduction with Applications
Statistics
ISBN:
9781119256830
Author:
Amos Gilat
Publisher:
John Wiley & Sons Inc
Probability and Statistics for Engineering and th…
Statistics
ISBN:
9781305251809
Author:
Jay L. Devore
Publisher:
Cengage Learning
Statistics for The Behavioral Sciences (MindTap C…
Statistics
ISBN:
9781305504912
Author:
Frederick J Gravetter, Larry B. Wallnau
Publisher:
Cengage Learning

Elementary Statistics: Picturing the World (7th E…
Statistics
ISBN:
9780134683416
Author:
Ron Larson, Betsy Farber
Publisher:
PEARSON

The Basic Practice of Statistics
Statistics
ISBN:
9781319042578
Author:
David S. Moore, William I. Notz, Michael A. Fligner
Publisher:
W. H. Freeman

Introduction to the Practice of Statistics
Statistics
ISBN:
9781319013387
Author:
David S. Moore, George P. McCabe, Bruce A. Craig
Publisher:
W. H. Freeman