The following table gives the average travel time to work for workers in each of the 50 states as well as the percentage of those workers who use public transportation. (a) Represent the data relating to the average travel times in a histogram. (b) Represent the data relating to the percentage of workers using public transportation in a stem and leaf plot.
The following table gives the average travel time to work for workers in each of the 50 states as well as the percentage of those workers who use public transportation. (a) Represent the data relating to the average travel times in a histogram. (b) Represent the data relating to the percentage of workers using public transportation in a stem and leaf plot.

Glencoe Algebra 1, Student Edition, 9780079039897, 0079039898, 2018
18th Edition
ISBN:9780079039897
Author:Carter
Publisher:Carter
Chapter10: Statistics
Section10.6: Summarizing Categorical Data
Problem 23PPS

Related questions

Question
100%
The following table gives the average travel time to work for workers in each of the
50 states as well as the percentage of those workers who use public transportation.
(a) Represent the data relating to the average travel times in a histogram.
(b) Represent the data relating to the percentage of workers using public
transportation in a stem and leaf plot.
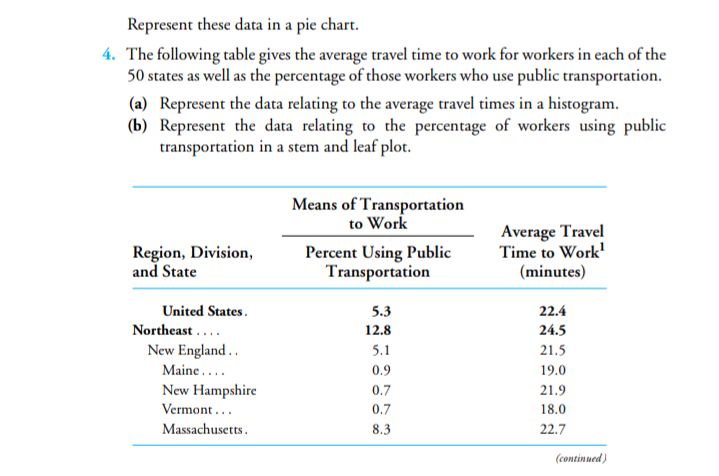
Transcribed Image Text:Represent these data in a pie chart.
4. The following table gives the average travel time to work for workers in each of the
50 states as well as the percentage of those workers who use public transportation.
(a) Represent the data relating to the average travel times in a histogram.
(b) Represent the data relating to the percentage of workers using public
transportation in a stem and leaf plot.
Means of Transportation
to Work
Region, Division,
and State
Percent Using Public
Transportation
Average Travel
Time to Work'
(minutes)
United States.
5.3
22.4
Northeast ....
12.8
24.5
New England..
Maine ....
New Hampshire
Vermont ...
5.1
21.5
0.9
19.0
0.7
21.9
0.7
18.0
Massachusetts.
8.3
22.7
(continued)
Expert Solution
This question has been solved!
Explore an expertly crafted, step-by-step solution for a thorough understanding of key concepts.

This is a popular solution!

Trending now
This is a popular solution!

Step by step
Solved in 3 steps with 3 images

Knowledge Booster


Learn more about
Need a deep-dive on the concept behind this application? Look no further. Learn more about this topic, statistics and related others by exploring similar questions and additional content below.Recommended textbooks for you
Glencoe Algebra 1, Student Edition, 9780079039897…
Algebra
ISBN:
9780079039897
Author:
Carter
Publisher:
McGraw Hill

Holt Mcdougal Larson Pre-algebra: Student Edition…
Algebra
ISBN:
9780547587776
Author:
HOLT MCDOUGAL
Publisher:
HOLT MCDOUGAL
Glencoe Algebra 1, Student Edition, 9780079039897…
Algebra
ISBN:
9780079039897
Author:
Carter
Publisher:
McGraw Hill
Holt Mcdougal Larson Pre-algebra: Student Edition…
Algebra
ISBN:
9780547587776
Author:
HOLT MCDOUGAL
Publisher:
HOLT MCDOUGAL