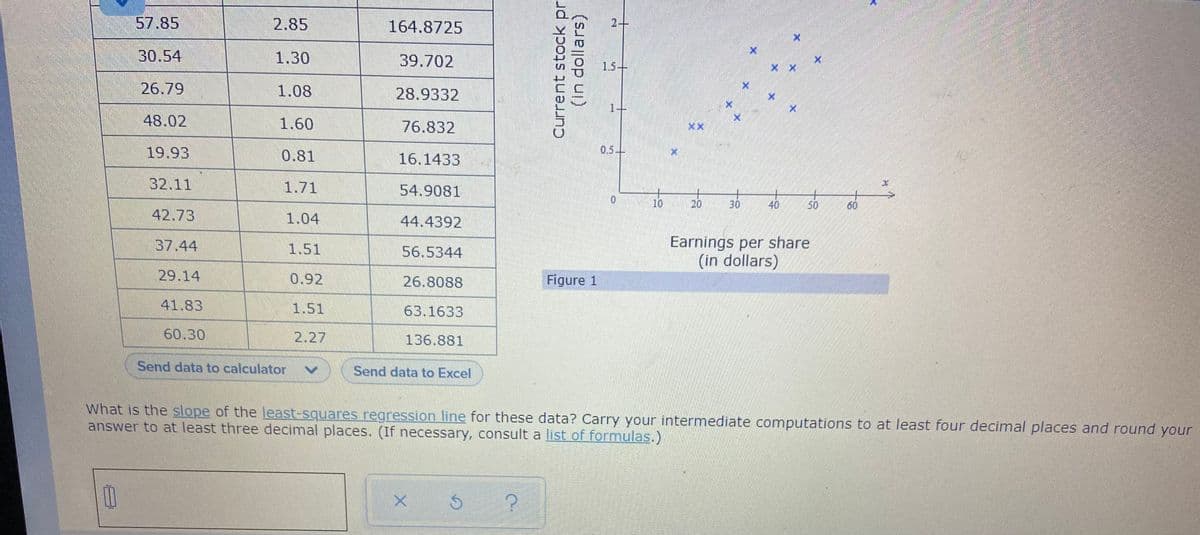
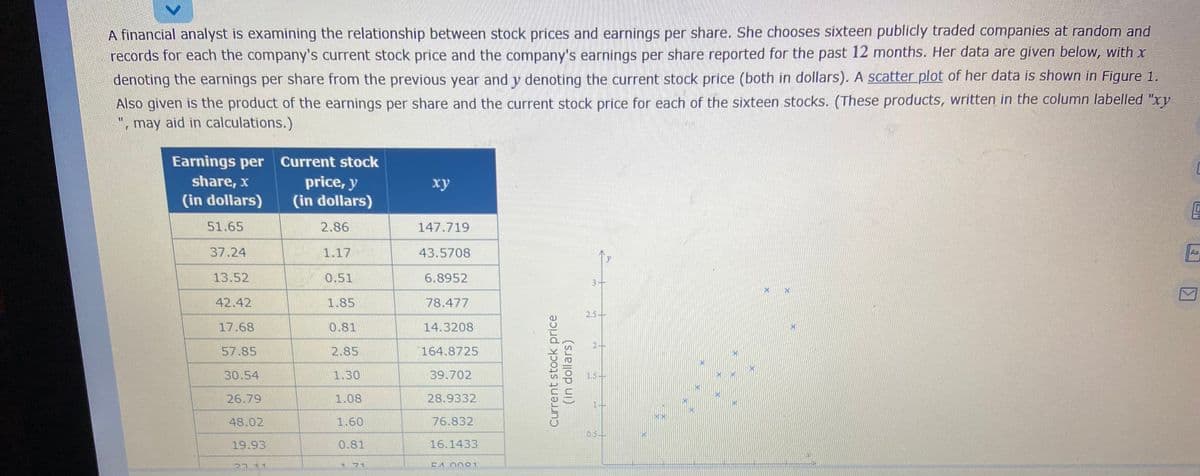
A financial analyst is examining the relationship between stock prices and earnings per share. She chooses sixteen publicly traded companies at random and records for each the company's current stock price and the company's earnings per share reported for the past 12 months. Her data are given below, with x denoting the earnings per share from the previous year and y denoting the current stock price (both in dollars). A scatter plot of her data is shown in Figure 1. Also given is the product of the earnings per share and the current stock price for each of the sixteen stocks. (These products, written in the column labelled "xy ", may aid in calculations.) Earnings per Current stock price, y (in dollars) share, x ху (in dollars) 51.65 2.86 147.719 37.24 1.17 43.5708 13.52 0.51 6,8952 42.42 1.85 78.477 17.68 0.81 14.3208 57.85 2.85 164.8725 30. 54 1.30 39.702 stock price (ssejo
A financial analyst is examining the relationship between stock prices and earnings per share. She chooses sixteen publicly traded companies at random and records for each the company's current stock price and the company's earnings per share reported for the past 12 months. Her data are given below, with x denoting the earnings per share from the previous year and y denoting the current stock price (both in dollars). A scatter plot of her data is shown in Figure 1. Also given is the product of the earnings per share and the current stock price for each of the sixteen stocks. (These products, written in the column labelled "xy ", may aid in calculations.) Earnings per Current stock price, y (in dollars) share, x ху (in dollars) 51.65 2.86 147.719 37.24 1.17 43.5708 13.52 0.51 6,8952 42.42 1.85 78.477 17.68 0.81 14.3208 57.85 2.85 164.8725 30. 54 1.30 39.702 stock price (ssejo

Linear Algebra: A Modern Introduction
4th Edition
ISBN:9781285463247
Author:David Poole
Publisher:David Poole
Chapter7: Distance And Approximation
Section7.3: Least Squares Approximation
Problem 31EQ

Related questions
Question
100%
Transcribed Image Text:57.85
2.85
164.8725
2-
30.54
1.30
39.702
1.5+
26.79
1.08
28.9332
48.02
1.60
76.832
XX
19.93
0.81
16.1433
0.5-
32.11
1.71
54.9081
0.
10
20
30
40
50
60
42.73
1.04
44.4392
Earnings per share
(in dollars)
37.44
1.51
56.5344
29.14
0.92
26.8088
Figure 1
41.83
1.51
63.1633
60.30
2.27
136.881
Send data to calculator
Send data to Excel
What is the slope of the least-squares regression line for these data? Carry your intermediate computations to at least four decimal places and round your
answer to at least three decimal places. (If necessary, consult a list of formulas.)
Current stock pri
(in dollars)
Transcribed Image Text:A financial analyst is examining the relationship between stock prices and earnings per share. She chooses sixteen publicly traded companies at random and
records for each the company's current stock price and the company's earnings per share reported for the past 12 months. Her data are given below, with x
denoting the earnings per share from the previous year and y denoting the current stock price (both in dollars). A scatter plot of her data is shown in Figure 1.
Also given is the product of the earnings per share and the current stock price for each of the sixteen stocks. (These products, written in the column labelled "xy
", may aid in calculations.)
Earnings per Current stock
price, y
(in dollars)
share, x
ху
(in dollars)
51.65
2.86
147.719
37.24
1.17
43.5708
An
13.52
0.51
6.8952
3-
42.42
1.85
78.477
2.5-
17.68
0.81
14.3208
2-
57.85
2.85
164.8725
30.54
1.30
39.702
1.5+
26.79
1.08
28.9332
48.02
1.60
76.832
0.5
19.93
0.81
16.1433
27 11
171
CA 0001
Current stock price
(in dollars)
Expert Solution
This question has been solved!
Explore an expertly crafted, step-by-step solution for a thorough understanding of key concepts.

This is a popular solution!

Trending now
This is a popular solution!

Step by step
Solved in 2 steps with 2 images

Recommended textbooks for you
Linear Algebra: A Modern Introduction
Algebra
ISBN:
9781285463247
Author:
David Poole
Publisher:
Cengage Learning

Glencoe Algebra 1, Student Edition, 9780079039897…
Algebra
ISBN:
9780079039897
Author:
Carter
Publisher:
McGraw Hill

Big Ideas Math A Bridge To Success Algebra 1: Stu…
Algebra
ISBN:
9781680331141
Author:
HOUGHTON MIFFLIN HARCOURT
Publisher:
Houghton Mifflin Harcourt
Linear Algebra: A Modern Introduction
Algebra
ISBN:
9781285463247
Author:
David Poole
Publisher:
Cengage Learning
Glencoe Algebra 1, Student Edition, 9780079039897…
Algebra
ISBN:
9780079039897
Author:
Carter
Publisher:
McGraw Hill
Big Ideas Math A Bridge To Success Algebra 1: Stu…
Algebra
ISBN:
9781680331141
Author:
HOUGHTON MIFFLIN HARCOURT
Publisher:
Houghton Mifflin Harcourt

Functions and Change: A Modeling Approach to Coll…
Algebra
ISBN:
9781337111348
Author:
Bruce Crauder, Benny Evans, Alan Noell
Publisher:
Cengage Learning

Holt Mcdougal Larson Pre-algebra: Student Edition…
Algebra
ISBN:
9780547587776
Author:
HOLT MCDOUGAL
Publisher:
HOLT MCDOUGAL