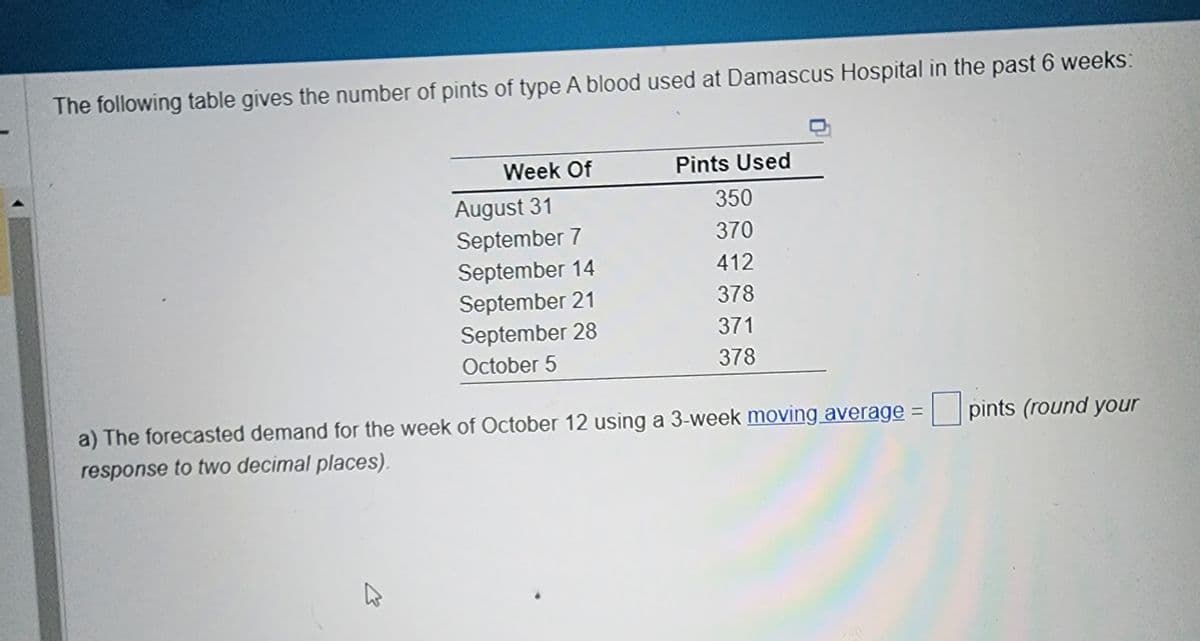
The following table gives the number of pints of type A blood used at Damascus Hospital in the past 6 weeks: Week Of August 31 September 7 September 14 September 21 September 28 October 5 Pints Used 350 370 412 378 371 378 a) The forecasted demand for the week of October 12 using a 3-week moving average = pints (round your response to two decimal places).
Q: Which alternative is best, according to each of the following decision criterion? Maximin Maximax…
A: Maximin, Maximax, and Minimax regret decision-making criteria are the three most popular…
Q: Discussion Questions* 1. Name and justify several factors that Hoffman could use in forecasting…
A: Forecasting – Several Factors: As per the given case, Hoffman can use the following…
Q: a) Draw a schedule showing the work package critical path and duration. b) Assume the wor kpackage…
A: a) Possible Paths Duration (weeks) A-B-C-F-N-O 4+3+3+2+12 = 24 A-B-C-F-1-J-O 4+3+3+2+3+3 =…
Q: 9. Mean time between failure O A. is used to measure a product's maintainability B. is used to…
A: Mean time between failures is a concept applied in operations management where long-term capital…
Q: Jake, a project manager for XYS Company, is developing the project plan for the implementation of a…
A: The cost, choice, and timeline associated with the work are factors that the supervisory committee…
Q: Referring to the above problem, solve it by the vogel approximation method
A: The transportation model is used to calculate the minimum cost of the route by selecting different…
Q: Ottis, Inc., uses 640,000 plastic housing units each year in its production of paper shredders. The…
A: Inventory management is the process of ordering, carrying, selling company ' s inventory. Economic…
Q: 2. Calculate the exponential smoothing forecast for week eight using a=0.2. Week Sales…
A: Forecasting is the process of estimating the future demand using the previous years information and…
Q: Outline the organisational documentation applicable to project integration and associated processes.
A: Integration management in projects is a sub field of project management that facilitates effective…
Q: Calculate the mean absolute percentage error (MAPE) for the cost equation you developed above.
A: MAPE stands for mean absolute percentage error. MAPE = (|(actual-forecast)/actual|*100)
Q: Identify the critical path(s)
A: Critical path is the one which has maximum duration. Activities on critical path are called as…
Q: The following are considered part of the EOQ computation: A) Holding costs B) Inventory costs C)…
A: To cut costs related to transportation, warehouse space, stockouts, and overstocks, firms employ an…
Q: Q1.1. Formulate the LP problem in a mathematical model. Q1.2. Minimum is obtained at what…
A: Linear programming is a mathematical method for solving a system of linear equations. It is an…
Q: Define the concept of a ratio
A: Ratio is useful for comparing one number with another number. It is indicated that how much one…
Q: Based on the critical ratio determined, the company would expect the stockout rate to be % (use the…
A: Here, Given the data, The selling price is 2 per loaf The cost is 0.50 per loaf As there is an 80%…
Q: A renovation of the gift shop at Orlando Amway Center has six activities (in hours). In the…
A: Given Data-
Q: Construct the precedence table, and hence draw the network for the project
A: An AOA diagram is a type of organizational chart that is used to represent the hierarchical…
Q: (ii) linear programming formulation Let x₁ = number of units i shipped to client j, using the…
A: Linear programming is a mathematical technique that is also used in operations management…
Q: A certain diet requires at least 60 units of carbohydrates, 45 units of protein, and 30 units of fat…
A: Let quantity of supplement A be x and that of Supplement B be y.
Q: Step 1 of 4: Determine the three-period moving average for the next time period. If necessary, round…
A: Forecasting is a technique used to predict future outcomes on the basis of past data. In businesses…
Q: A linear programming problem is given as below. What is the optimal solution (X1, X2)? Maximize:…
A: NOTE : As no particular method is specified I did in Graphical Method. MAX zx = 5 X1 + 3 X2…
Q: To monitor the number of blemishes on a polished surface a company randomly selects 10 units of…
A: C-chart is a model of control chart which identifying the controllability based on counted type of…
Q: The selling price per box for Cynthia's Cookies is $20.24. Fixed costs are $60,000 and the variable…
A: Selling Price per box = SP = $20.24 Fixed Costs = FC = $60000 Variable Cost per box = VC = $10.43
Q: There are four categories of purchases that are made by the buying department. With reference to…
A: As per the Kraljic portfolio purchasing model, the purchase is categorised into four categories on…
Q: Complete the Table below, if you need more space feel free to provide the answer below the provided…
A: Organization Service/Manufacturing Process Structure Divergence and Lineflow Customer Contact 1.…
Q: RMC, Inc., is a small firm that produces a variety of chemical products. In a particular production…
A: Material 1 Material 2 Material 3 Profit Fuel additive 0.4 0 0.6 $40 Solvent base 0.5 0.2 0.3…
Q: 1.Differentiate between international and global sourcing management 2. Critically discuss the…
A: "Since you have asked multiple questions, we will solve the first question for you. If you want any…
Q: What is the optimal order quantity for paperclips at their Bethesda store? (b) Assuming 50 weeks in…
A: Given the data stated below, The weekly demand=100 boxes The purchase price per box=2 There are 50…
Q: Year Year Forecast (000) 1 2 3 4.00 7.00 5.00 1 5.00 Registrations (000) a) Calculate the forecasted…
A: The exponential smoothing forecast is a form of time series forecasting that is used to predict…
Q: The production planner for a private label soft drink maker is planning the production of two soft…
A: Decision Variables: R = Number of Optimal Root Beers to be producedS = Number of Optimal Sassafras…
Q: Formulate but do not solve the problem. A manufacturer of women's blouses makes three types of…
A: Decision Variables:x, y, and z denote the amount of sleeveless, short-sleeve, and long-sleeve…
Q: a. Where is the bottleneck workstation? Round your answer to two decimal places. The bottleneck is…
A: As per Bartleby guidelines, we can only solve the first three subparts of one question at a…
Q: A boutique cafe in the city operates 365 days a year. The cafe has an annual demand for food…
A:
Q: 8. One bag of "Fertilizer A" contains 2 units of phosphorus, 5 units of nitrogen, and 3 units of…
A: Based on the given information, the LP formulation will be as follows. Objective Function:Minimize…
Q: Café Michigan's manager, Gary Stark, suspects that demand for mocha latte coffees depends on the…
A: Linear Regression Assume X = Price Y = Number sold X Y XY X2 2.70…
Q: one of your projects team members is highly regarded for her skills in the company. she is assigned…
A: A high-visibility project means that the project is highly important for the company and in market…
Q: The Barberton Municipal division of Road Maintenance is charged with road repair in the city of…
A: The operations level workforce plan is an important component of the overall business strategy. It…
Q: T or F Logistics management is the primary process of supply chain management.
A:
Q: Article 1: South African pears will soon be on sale in China for the first time • Consumers in China…
A: Mainly, the company can use two transport modes to get their products to China, they are airways and…
Q: Suppose a project manager is reviewing the project management plan, the work performance data, and…
A: A project, according to the Project Management Institute (PMI), is a short-term activity that is…
Q: A firm is weighing three capacity alternatives: small, medium, and large job shop. Whatever capacity…
A: EMV is a method which identifying the highest monitory value indicating option based on the…
Q: You are the marketing director for a minor league baseball team, and (not unlike a certain major…
A: As per the given information, attendance in a number depends on the competitiveness of the team,…
Q: 1-What is the difference between qualitative forecasting techniques and quantitative forecasting…
A: Forecasting is the process of identifying trends in order to predict future outcomes. Forecasting is…
Q: 1. Explain the meaning of the term production or operations and describe the three kinds of utility…
A: As per guidelines, answering the 1st question. 1. Production/operations refers to the process in…
Q: analyse the role of operations management capacity planning and control in a clothing business and…
A: Operations management is the process of designing, implementing, and controlling the production and…
Q: 2. Supply management is not an isolated department. Explain how it is related to other departments.
A: Supply chain management is the management in which different processes, technologies, and employees…
Q: An assembly line with 17 tasks is to be balanced. The longest task is 2.2 minutes and the total time…
A:
Q: 3. How does assault differ from battery? A. Battery is an injury to person, assault is an injury to…
A: How does assault differ from battery? A. Battery is an injury to person, assault is an injury to…
Q: When a company in the U.S. contracts some of their jobs to other firms. These firms may be in the…
A: Manufacturing Offshoring is the act of locating parts of a company's operations or services abroad…
Q: Which option (a, b, c, or d) shows the correct objective function and constraints for this…
A: Linear programming is a mathematical optimization technique for determining an optimal solution to a…
Step by step
Solved in 2 steps with 2 images
- The owner of a restaurant in Bloomington, Indiana, has recorded sales data for the past 19 years. He has also recorded data on potentially relevant variables. The data are listed in the file P13_17.xlsx. a. Estimate a simple regression equation involving annual sales (the dependent variable) and the size of the population residing within 10 miles of the restaurant (the explanatory variable). Interpret R-square for this regression. b. Add another explanatory variableannual advertising expendituresto the regression equation in part a. Estimate and interpret this expanded equation. How does the R-square value for this multiple regression equation compare to that of the simple regression equation estimated in part a? Explain any difference between the two R-square values. How can you use the adjusted R-squares for a comparison of the two equations? c. Add one more explanatory variable to the multiple regression equation estimated in part b. In particular, estimate and interpret the coefficients of a multiple regression equation that includes the previous years advertising expenditure. How does the inclusion of this third explanatory variable affect the R-square, compared to the corresponding values for the equation of part b? Explain any changes in this value. What does the adjusted R-square for the new equation tell you?The Baker Company wants to develop a budget to predict how overhead costs vary with activity levels. Management is trying to decide whether direct labor hours (DLH) or units produced is the better measure of activity for the firm. Monthly data for the preceding 24 months appear in the file P13_40.xlsx. Use regression analysis to determine which measure, DLH or Units (or both), should be used for the budget. How would the regression equation be used to obtain the budget for the firms overhead costs?The file P13_42.xlsx contains monthly data on consumer revolving credit (in millions of dollars) through credit unions. a. Use these data to forecast consumer revolving credit through credit unions for the next 12 months. Do it in two ways. First, fit an exponential trend to the series. Second, use Holts method with optimized smoothing constants. b. Which of these two methods appears to provide the best forecasts? Answer by comparing their MAPE values.
- The file P13_29.xlsx contains monthly time series data for total U.S. retail sales of building materials (which includes retail sales of building materials, hardware and garden supply stores, and mobile home dealers). a. Is seasonality present in these data? If so, characterize the seasonality pattern. b. Use Winters method to forecast this series with smoothing constants = = 0.1 and = 0.3. Does the forecast series seem to track the seasonal pattern well? What are your forecasts for the next 12 months?The file P13_02.xlsx contains five years of monthly data on sales (number of units sold) for a particular company. The company suspects that except for random noise, its sales are growing by a constant percentage each month and will continue to do so for at least the near future. a. Explain briefly whether the plot of the series visually supports the companys suspicion. b. By what percentage are sales increasing each month? c. What is the MAPE for the forecast model in part b? In words, what does it measure? Considering its magnitude, does the model seem to be doing a good job? d. In words, how does the model make forecasts for future months? Specifically, given the forecast value for the last month in the data set, what simple arithmetic could you use to obtain forecasts for the next few months?The file P13_22.xlsx contains total monthly U.S. retail sales data. While holding out the final six months of observations for validation purposes, use the method of moving averages with a carefully chosen span to forecast U.S. retail sales in the next year. Comment on the performance of your model. What makes this time series more challenging to forecast?
- The file P13_28.xlsx contains monthly retail sales of U.S. liquor stores. a. Is seasonality present in these data? If so, characterize the seasonality pattern. b. Use Winters method to forecast this series with smoothing constants = = 0.1 and = 0.3. Does the forecast series seem to track the seasonal pattern well? What are your forecasts for the next 12 months?The file P13_26.xlsx contains the monthly number of airline tickets sold by the CareFree Travel Agency. a. Create a time series chart of the data. Based on what you see, which of the exponential smoothing models do you think will provide the best forecasting model? Why? b. Use simple exponential smoothing to forecast these data, using a smoothing constant of 0.1. c. Repeat part b, but search for the smoothing constant that makes RMSE as small as possible. Does it make much of an improvement over the model in part b?A small computer chip manufacturer wants to forecast monthly ozperating costs as a function of the number of units produced during a month. The company has collected the 16 months of data in the file P13_34.xlsx. a. Determine an equation that can be used to predict monthly production costs from units produced. Are there any outliers? b. How could the regression line obtained in part a be used to determine whether the company was efficient or inefficient during any particular month?
- The management of a technology company is trying to determine the variable that best explains the variation of employee salaries using a sample of 52 full-time employees; see the file P13_08.xlsx. Estimate simple linear regression equations to identify which of the following has the strongest linear relationship with annual salary: the employees gender, age, number of years of relevant work experience prior to employment at the company, number of years of employment at the company, or number of years of post secondary education. Provide support for your conclusion.Suppose that a regional express delivery service company wants to estimate the cost of shipping a package (Y) as a function of cargo type, where cargo type includes the following possibilities: fragile, semifragile, and durable. Costs for 15 randomly chosen packages of approximately the same weight and same distance shipped, but of different cargo types, are provided in the file P13_16.xlsx. a. Estimate a regression equation using the given sample data, and interpret the estimated regression coefficients. b. According to the estimated regression equation, which cargo type is the most costly to ship? Which cargo type is the least costly to ship? c. How well does the estimated equation fit the given sample data? How might the fit be improved? d. Given the estimated regression equation, predict the cost of shipping a package with semifragile cargo.Do the sales prices of houses in a given community vary systematically with their sizes (as measured in square feet)? Answer this question by estimating a simple regression equation where the sales price of the house is the dependent variable, and the size of the house is the explanatory variable. Use the sample data given in P13_06.xlsx. Interpret your estimated equation, the associated R-square value, and the associated standard error of estimate.