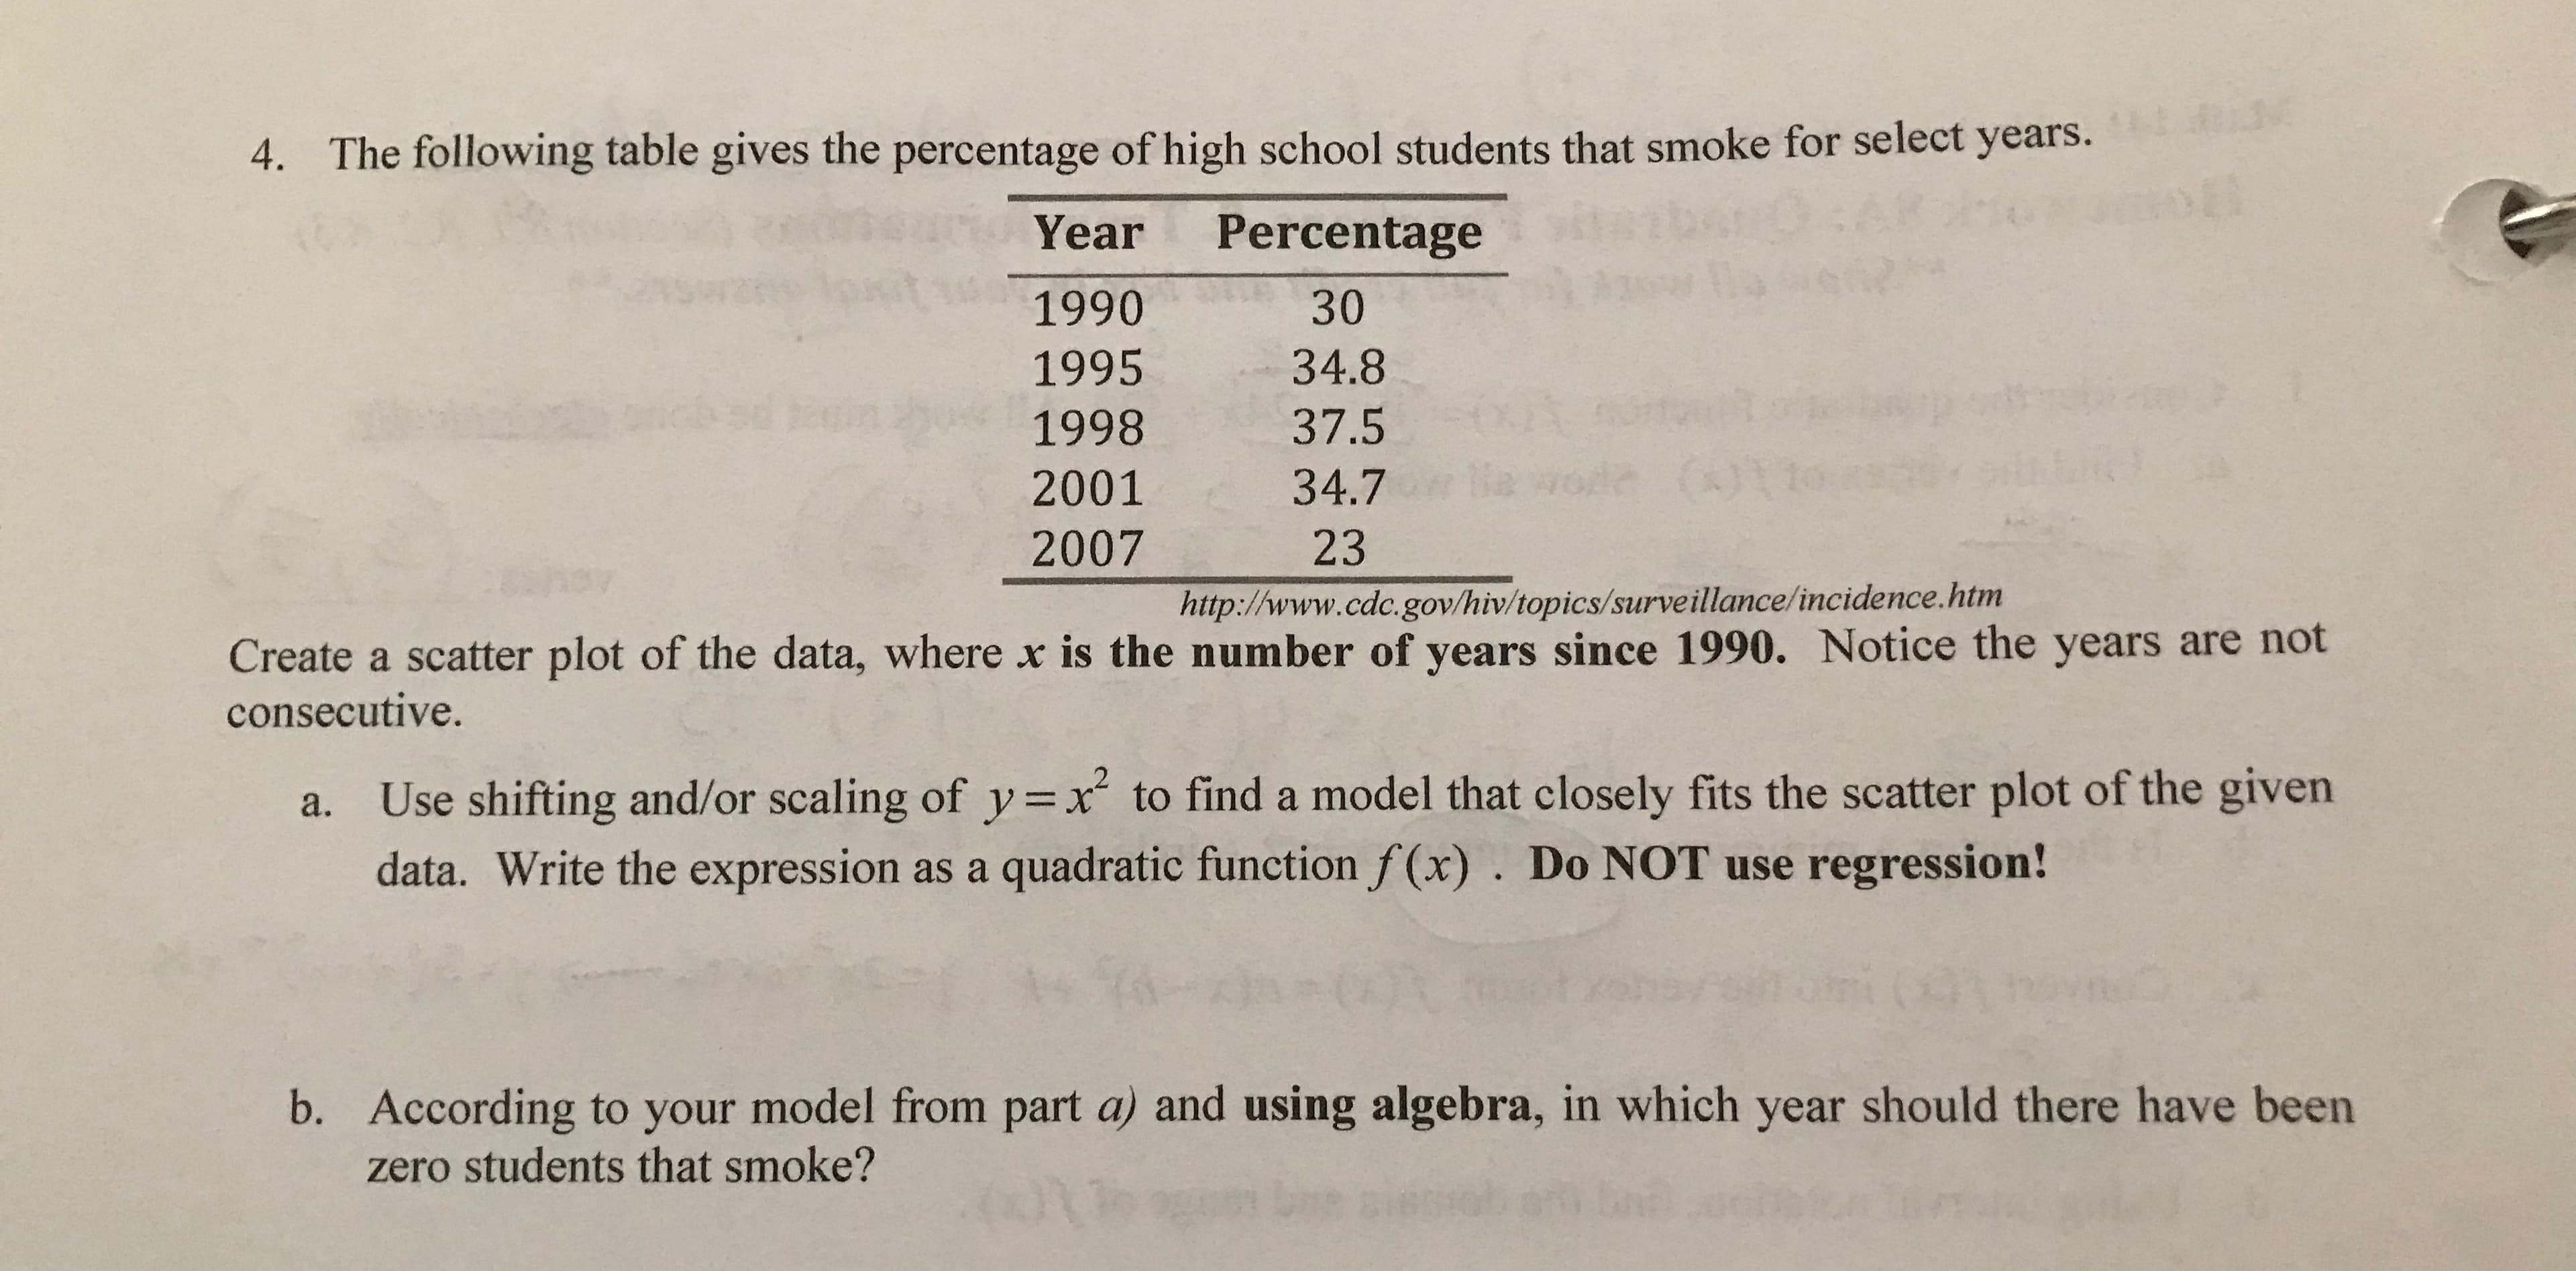
The following table gives the percentage of high school students that smoke for select years. 4. t3: Year Percentage 1990 30 1995 34.8 37.5 1998 (01 e de 34.7 2001 2007 23 http://www.cdc. gov/hiv/topics/surveillance/incidence.htm Create a scatter plot of the data, where x is the number of years since 1990. Notice the years are not consecutive. Use shifting and/or scaling of y=x to find a model that closely fits the scatter plot of the given data. Write the expression as a quadratic function f(x). Do NOT use regression! a. b. According to your model from part a) and using algebra, in which year should there have been zero students that smoke? ni
The following table gives the percentage of high school students that smoke for select years. 4. t3: Year Percentage 1990 30 1995 34.8 37.5 1998 (01 e de 34.7 2001 2007 23 http://www.cdc. gov/hiv/topics/surveillance/incidence.htm Create a scatter plot of the data, where x is the number of years since 1990. Notice the years are not consecutive. Use shifting and/or scaling of y=x to find a model that closely fits the scatter plot of the given data. Write the expression as a quadratic function f(x). Do NOT use regression! a. b. According to your model from part a) and using algebra, in which year should there have been zero students that smoke? ni

Chapter5: Exponential And Logarithmic Functions
Section5.5: Exponential And Logarithmic Models
Problem 4ECP

Related questions
Question
100%
Transcribed Image Text:The following table gives the percentage of high school students that smoke for select years.
4.
t3:
Year
Percentage
1990
30
1995
34.8
37.5
1998
(01
e
de
34.7
2001
2007
23
http://www.cdc. gov/hiv/topics/surveillance/incidence.htm
Create a scatter plot of the data, where x is the number of years since 1990. Notice the years are not
consecutive.
Use shifting and/or scaling of y=x to find a model that closely fits the scatter plot of the given
data. Write the expression as a quadratic function f(x). Do NOT use regression!
a.
b. According to your model from part a) and using algebra, in which year should there have been
zero students that smoke?
ni
Expert Solution
This question has been solved!
Explore an expertly crafted, step-by-step solution for a thorough understanding of key concepts.

This is a popular solution!

Trending now
This is a popular solution!

Step by step
Solved in 4 steps with 2 images

Recommended textbooks for you

Glencoe Algebra 1, Student Edition, 9780079039897…
Algebra
ISBN:
9780079039897
Author:
Carter
Publisher:
McGraw Hill

Big Ideas Math A Bridge To Success Algebra 1: Stu…
Algebra
ISBN:
9781680331141
Author:
HOUGHTON MIFFLIN HARCOURT
Publisher:
Houghton Mifflin Harcourt
Glencoe Algebra 1, Student Edition, 9780079039897…
Algebra
ISBN:
9780079039897
Author:
Carter
Publisher:
McGraw Hill
Big Ideas Math A Bridge To Success Algebra 1: Stu…
Algebra
ISBN:
9781680331141
Author:
HOUGHTON MIFFLIN HARCOURT
Publisher:
Houghton Mifflin Harcourt