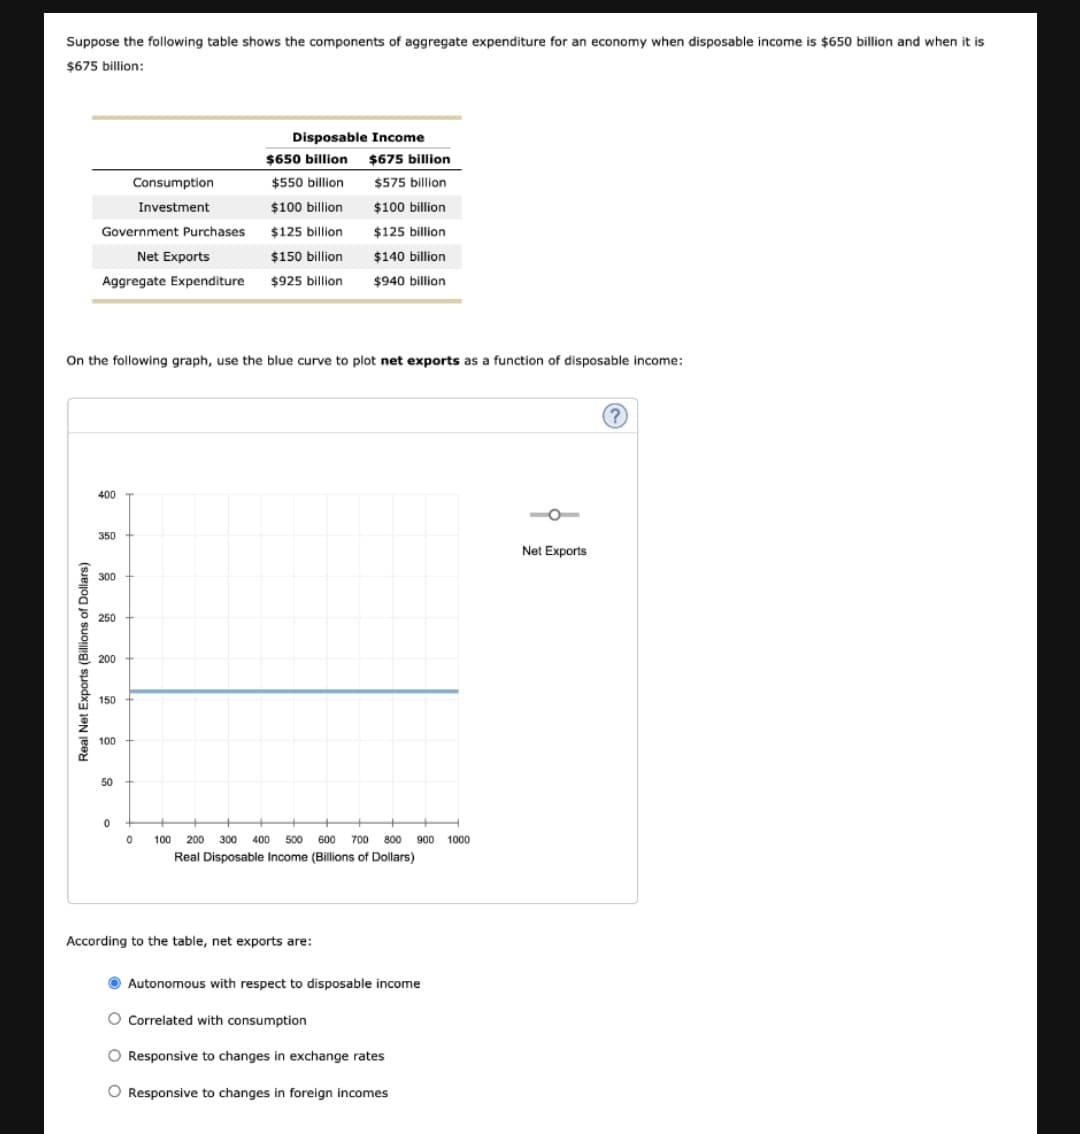
Suppose the following table shows the components of aggregate expenditure for an economy when disposable income is $650 billion and when it is $675 billion: Disposable Income $650 billion $675 billion Consumption $550 billion $575 billion Investment $100 billion $100 billion Government Purchases $125 billion $125 billion Net Exports $150 billion $140 billion Aggregate Expenditure $925 billion $940 billion On the following graph, use the blue curve to plot net exports as a function of disposable income:


Correlation
Correlation defines a relationship between two independent variables. It tells the degree to which variables move in relation to each other. When two sets of data are related to each other, there is a correlation between them.
Linear Correlation
A correlation is used to determine the relationships between numerical and categorical variables. In other words, it is an indicator of how things are connected to one another. The correlation analysis is the study of how variables are related.
Regression Analysis
Regression analysis is a statistical method in which it estimates the relationship between a dependent variable and one or more independent variable. In simple terms dependent variable is called as outcome variable and independent variable is called as predictors. Regression analysis is one of the methods to find the trends in data. The independent variable used in Regression analysis is named Predictor variable. It offers data of an associated dependent variable regarding a particular outcome.


Trending now
This is a popular solution!

Step by step
Solved in 3 steps with 2 images


