The following table lists the percentages of space for eight magazines that contain advertisements and the prices of those magazines. Percentage containing ads 35 42 56 48 67 25 62 34 Price ($) 5.50 6.95 4.95 5.75 3.95 8.25 5.50 6.75 a. Construct a 98% confidence interval for B. Round your answers to three decimal places. to i b. Testing at a 5% significance level, can you conclude that B is different from zero? Based on a 5% significance level test, we conclude that B different from zero.
The following table lists the percentages of space for eight magazines that contain advertisements and the prices of those magazines. Percentage containing ads 35 42 56 48 67 25 62 34 Price ($) 5.50 6.95 4.95 5.75 3.95 8.25 5.50 6.75 a. Construct a 98% confidence interval for B. Round your answers to three decimal places. to i b. Testing at a 5% significance level, can you conclude that B is different from zero? Based on a 5% significance level test, we conclude that B different from zero.

College Algebra (MindTap Course List)
12th Edition
ISBN:9781305652231
Author:R. David Gustafson, Jeff Hughes
Publisher:R. David Gustafson, Jeff Hughes
Chapter8: Sequences, Series, And Probability
Section8.7: Probability
Problem 58E: What is meant by the sample space of an experiment?

Related questions
Topic Video
Question
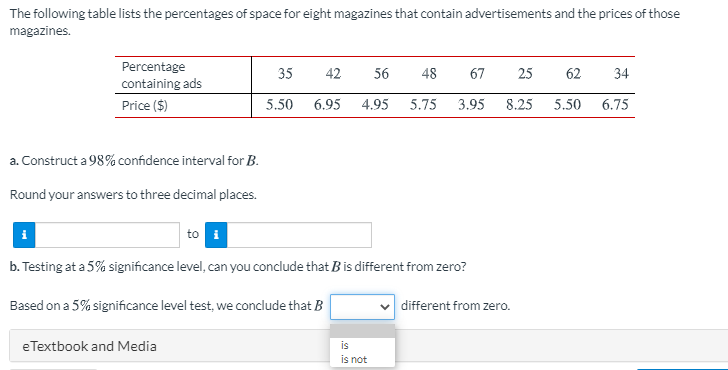
Transcribed Image Text:The following table lists the percentages of space for eight magazines that contain advertisements and the prices of those
magazines.
Percentage
35
42
56
48
67
25
62
34
containing ads
Price ($)
5.50
6.95
4.95
5.75
3.95
8.25
5.50
6.75
a. Construct a 98% confidence interval for B.
Round your answers to three decimal places.
to
b. Testing at a 5% significance level, can you conclude that Bis different from zero?
Based on a 5% significance level test, we conclude that B
different from zero.
is
is not
eTextbook and Media
Expert Solution
This question has been solved!
Explore an expertly crafted, step-by-step solution for a thorough understanding of key concepts.

Step by step
Solved in 3 steps with 1 images

Knowledge Booster


Learn more about
Need a deep-dive on the concept behind this application? Look no further. Learn more about this topic, statistics and related others by exploring similar questions and additional content below.Recommended textbooks for you
College Algebra (MindTap Course List)
Algebra
ISBN:
9781305652231
Author:
R. David Gustafson, Jeff Hughes
Publisher:
Cengage Learning
College Algebra (MindTap Course List)
Algebra
ISBN:
9781305652231
Author:
R. David Gustafson, Jeff Hughes
Publisher:
Cengage Learning