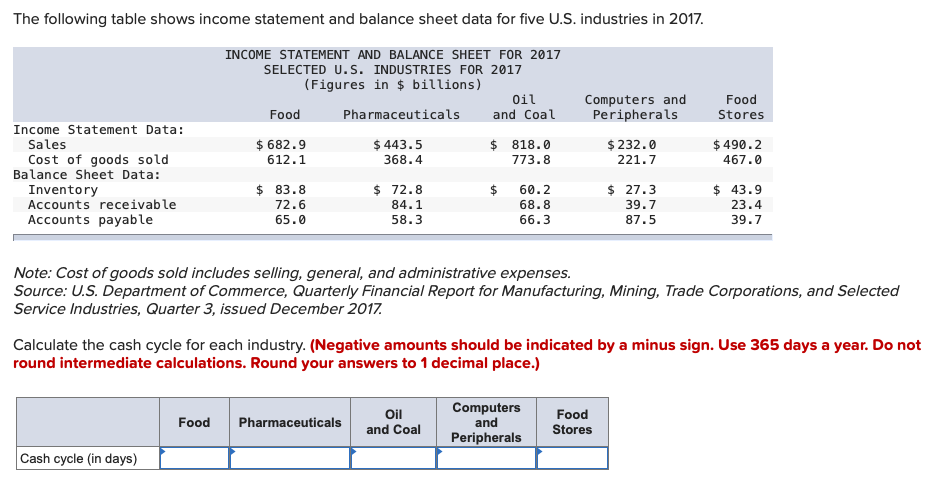
The following table shows income statement and balance sheet data for five U.S. industries in 2017. INCOME STATEMENT AND BALANCE SHEET FOR 2017 SELECTED U.S. INDUSTRIES FOR 2017 (Figures in $ billions) Oil and Coal Computers and Peripherals Food Food Pharmaceuticals Stores Income Statement Data: $ 682.9 $ 443.5 $ 232.0 221.7 $ 490.2 467.0 Sales $ 818.0 Cost of goods sold Balance Sheet Data: 612.1 368.4 773.8 Inventory Accounts receivable Accounts payable $ 83.8 72.6 $ 72.8 84.1 $ 27.3 39.7 $ 43.9 23.4 60.2 68.8 65.0 58.3 66.3 87.5 39.7 Note: Cost of goods sold includes selling, general, and administrative expenses. Source: U.S. Department of Commerce, Quarterly Financial Report for Manufacturing, Mining, Trade Corporations, and Selected Service Industries, Quarter 3, issued December 2017. Calculate the cash cycle for each industry. (Negative amounts should be indicated by a minus sign. Use 365 days a year. Do not round intermediate calculations. Round your answers to 1 decimal place.) Computers and Peripherals Food Stores Oil Food Pharmaceuticals and Coal Cash cycle (in days)
The following table shows income statement and balance sheet data for five U.S. industries in 2017. INCOME STATEMENT AND BALANCE SHEET FOR 2017 SELECTED U.S. INDUSTRIES FOR 2017 (Figures in $ billions) Oil and Coal Computers and Peripherals Food Food Pharmaceuticals Stores Income Statement Data: $ 682.9 $ 443.5 $ 232.0 221.7 $ 490.2 467.0 Sales $ 818.0 Cost of goods sold Balance Sheet Data: 612.1 368.4 773.8 Inventory Accounts receivable Accounts payable $ 83.8 72.6 $ 72.8 84.1 $ 27.3 39.7 $ 43.9 23.4 60.2 68.8 65.0 58.3 66.3 87.5 39.7 Note: Cost of goods sold includes selling, general, and administrative expenses. Source: U.S. Department of Commerce, Quarterly Financial Report for Manufacturing, Mining, Trade Corporations, and Selected Service Industries, Quarter 3, issued December 2017. Calculate the cash cycle for each industry. (Negative amounts should be indicated by a minus sign. Use 365 days a year. Do not round intermediate calculations. Round your answers to 1 decimal place.) Computers and Peripherals Food Stores Oil Food Pharmaceuticals and Coal Cash cycle (in days)

Financial Accounting
14th Edition
ISBN:9781305088436
Author:Carl Warren, Jim Reeve, Jonathan Duchac
Publisher:Carl Warren, Jim Reeve, Jonathan Duchac
Chapter17: Financial Statement Analysis
Section: Chapter Questions
Problem 17E

Related questions
Question
Transcribed Image Text:The following table shows income statement and balance sheet data for five U.S. industries in 2017.
INCOME STATEMENT AND BALANCE SHEET FOR 2017
SELECTED U.S. INDUSTRIES FOR 2017
(Figures in $ billions)
Oil
and Coal
Computers and
Peripherals
Food
Food
Pharmaceuticals
Stores
Income Statement Data:
$ 682.9
$ 443.5
$ 232.0
221.7
$ 490.2
467.0
Sales
$ 818.0
Cost of goods sold
Balance Sheet Data:
612.1
368.4
773.8
Inventory
Accounts receivable
Accounts payable
$ 83.8
72.6
$ 72.8
84.1
$ 27.3
39.7
87.5
$ 43.9
23.4
39.7
60.2
68.8
65.0
58.3
66.3
Note: Cost of goods sold includes selling, general, and administrative expenses.
Source: U.S. Department of Commerce, Quarterly Financial Report for Manufacturing, Mining, Trade Corporations, and Selected
Service Industries, Quarter 3, issued December 2017.
Calculate the cash cycle for each industry. (Negative amounts should be indicated by a minus sign. Use 365 days a year. Do not
round intermediate calculations. Round your answers to 1 decimal place.)
Computers
and
Oil
Food
Food
Pharmaceuticals
and Coal
Stores
Peripherals
Cash cycle (in days)
Expert Solution
This question has been solved!
Explore an expertly crafted, step-by-step solution for a thorough understanding of key concepts.

Step by step
Solved in 6 steps

Knowledge Booster


Learn more about
Need a deep-dive on the concept behind this application? Look no further. Learn more about this topic, accounting and related others by exploring similar questions and additional content below.Recommended textbooks for you
Financial Accounting
Accounting
ISBN:
9781305088436
Author:
Carl Warren, Jim Reeve, Jonathan Duchac
Publisher:
Cengage Learning

Financial Accounting: The Impact on Decision Make…
Accounting
ISBN:
9781305654174
Author:
Gary A. Porter, Curtis L. Norton
Publisher:
Cengage Learning

Pfin (with Mindtap, 1 Term Printed Access Card) (…
Finance
ISBN:
9780357033609
Author:
Randall Billingsley, Lawrence J. Gitman, Michael D. Joehnk
Publisher:
Cengage Learning
Financial Accounting
Accounting
ISBN:
9781305088436
Author:
Carl Warren, Jim Reeve, Jonathan Duchac
Publisher:
Cengage Learning
Financial Accounting: The Impact on Decision Make…
Accounting
ISBN:
9781305654174
Author:
Gary A. Porter, Curtis L. Norton
Publisher:
Cengage Learning
Pfin (with Mindtap, 1 Term Printed Access Card) (…
Finance
ISBN:
9780357033609
Author:
Randall Billingsley, Lawrence J. Gitman, Michael D. Joehnk
Publisher:
Cengage Learning

EBK CONTEMPORARY FINANCIAL MANAGEMENT
Finance
ISBN:
9781337514835
Author:
MOYER
Publisher:
CENGAGE LEARNING - CONSIGNMENT