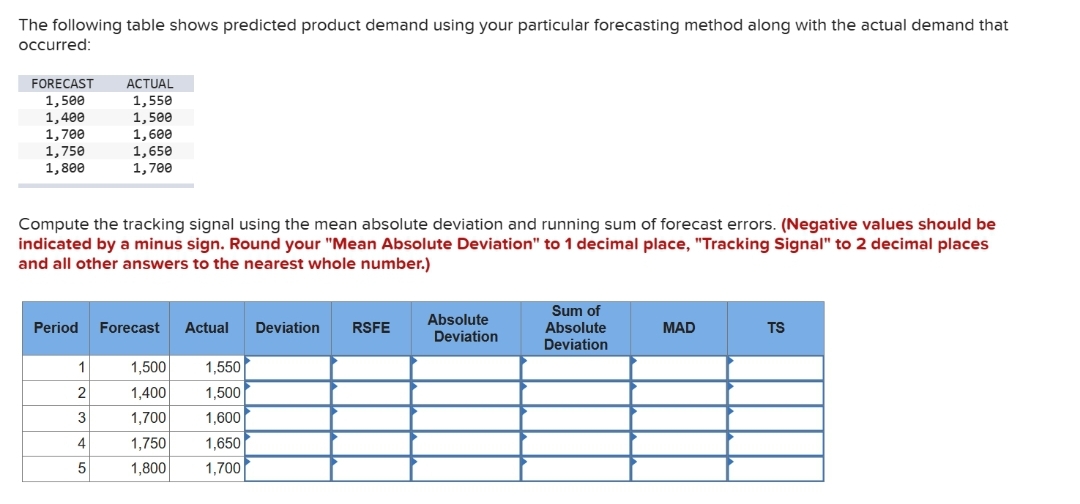
The following table shows predicted product demand using your particular forecasting method along with the actual demand that occurred: FORECAST ACTUAL 1,500 1,550 1,400 1,500 1,700 1,600 1,750 1,650 1,800 1,700 Compute the tracking signal using the mean absolute deviation and running sum of forecast errors. (Negative values should be indicated by a minus sign. Round your "Mean Absolute Deviation" to 1 decimal place, "Tracking Signal" to 2 decimal places and all other answers to the nearest whole number.) Period Forecast Actual Deviation RSFE 1 2 3 4 5 1,500 1,550 1,400 1,500 1,700 1,600 1,750 1,650 1,800 1,700 Absolute Deviation Sum of Absolute Deviation MAD TS
The following table shows predicted product demand using your particular forecasting method along with the actual demand that occurred: FORECAST ACTUAL 1,500 1,550 1,400 1,500 1,700 1,600 1,750 1,650 1,800 1,700 Compute the tracking signal using the mean absolute deviation and running sum of forecast errors. (Negative values should be indicated by a minus sign. Round your "Mean Absolute Deviation" to 1 decimal place, "Tracking Signal" to 2 decimal places and all other answers to the nearest whole number.) Period Forecast Actual Deviation RSFE 1 2 3 4 5 1,500 1,550 1,400 1,500 1,700 1,600 1,750 1,650 1,800 1,700 Absolute Deviation Sum of Absolute Deviation MAD TS

Managerial Economics: Applications, Strategies and Tactics (MindTap Course List)
14th Edition
ISBN:9781305506381
Author:James R. McGuigan, R. Charles Moyer, Frederick H.deB. Harris
Publisher:James R. McGuigan, R. Charles Moyer, Frederick H.deB. Harris
Chapter5: Business And Economic Forecasting
Section: Chapter Questions
Problem 9E: Savings-Mart (a chain of discount department stores) sells patio and lawn furniture. Sales are...

Related questions
Question
Gg.111.
Transcribed Image Text:The following table shows predicted product demand using your particular forecasting method along with the actual demand that
occurred:
FORECAST ACTUAL
1,500
1,550
1,400
1,500
1,700
1,600
1,750
1,800
1,650
1,700
Compute the tracking signal using the mean absolute deviation and running sum of forecast errors. (Negative values should be
indicated by a minus sign. Round your "Mean Absolute Deviation" to 1 decimal place, "Tracking Signal" to 2 decimal places
and all other answers to the nearest whole number.)
Period Forecast Actual Deviation
1
2
3
4
5
1,500 1,550
1,400 1,500
1,700
1,600
1,750
1,650
1,800
1,700
RSFE
Absolute
Deviation
Sum of
Absolute
Deviation
MAD
TS
Expert Solution
This question has been solved!
Explore an expertly crafted, step-by-step solution for a thorough understanding of key concepts.

This is a popular solution!

Trending now
This is a popular solution!

Step by step
Solved in 3 steps with 2 images

Knowledge Booster


Learn more about
Need a deep-dive on the concept behind this application? Look no further. Learn more about this topic, economics and related others by exploring similar questions and additional content below.Recommended textbooks for you
Managerial Economics: Applications, Strategies an…
Economics
ISBN:
9781305506381
Author:
James R. McGuigan, R. Charles Moyer, Frederick H.deB. Harris
Publisher:
Cengage Learning
Managerial Economics: Applications, Strategies an…
Economics
ISBN:
9781305506381
Author:
James R. McGuigan, R. Charles Moyer, Frederick H.deB. Harris
Publisher:
Cengage Learning