The following table shows retail sales in drug stores in billions of dollars in the U.S. for years since 1995. Year Retail Sales 85.851 3 108.426 6 141.781 9. 169.256 12 202.297 15 222.266 Let S(t) be the retails sales in billions of dollars in t years since 1995. A linear model for the data is F(t) = 9.44t + 84.182. 220 210 200 190 180 170 160 150 140 130 120 110 100 90 3 6 12 15 804 Use the above scatter plot to decide whether the linear model fits the data well. The function is a good model for the data. The function is not a good model for the data Estimate the retails sales in the U. S. in 2012.
The following table shows retail sales in drug stores in billions of dollars in the U.S. for years since 1995. Year Retail Sales 85.851 3 108.426 6 141.781 9. 169.256 12 202.297 15 222.266 Let S(t) be the retails sales in billions of dollars in t years since 1995. A linear model for the data is F(t) = 9.44t + 84.182. 220 210 200 190 180 170 160 150 140 130 120 110 100 90 3 6 12 15 804 Use the above scatter plot to decide whether the linear model fits the data well. The function is a good model for the data. The function is not a good model for the data Estimate the retails sales in the U. S. in 2012.

Functions and Change: A Modeling Approach to College Algebra (MindTap Course List)
6th Edition
ISBN:9781337111348
Author:Bruce Crauder, Benny Evans, Alan Noell
Publisher:Bruce Crauder, Benny Evans, Alan Noell
Chapter5: A Survey Of Other Common Functions
Section5.6: Higher-degree Polynomials And Rational Functions
Problem 1TU: The following fictitious table shows kryptonite price, in dollar per gram, t years after 2006. t=...

Related questions
Question
Transcribed Image Text:12:05
ll 5G
A myopenmath.com
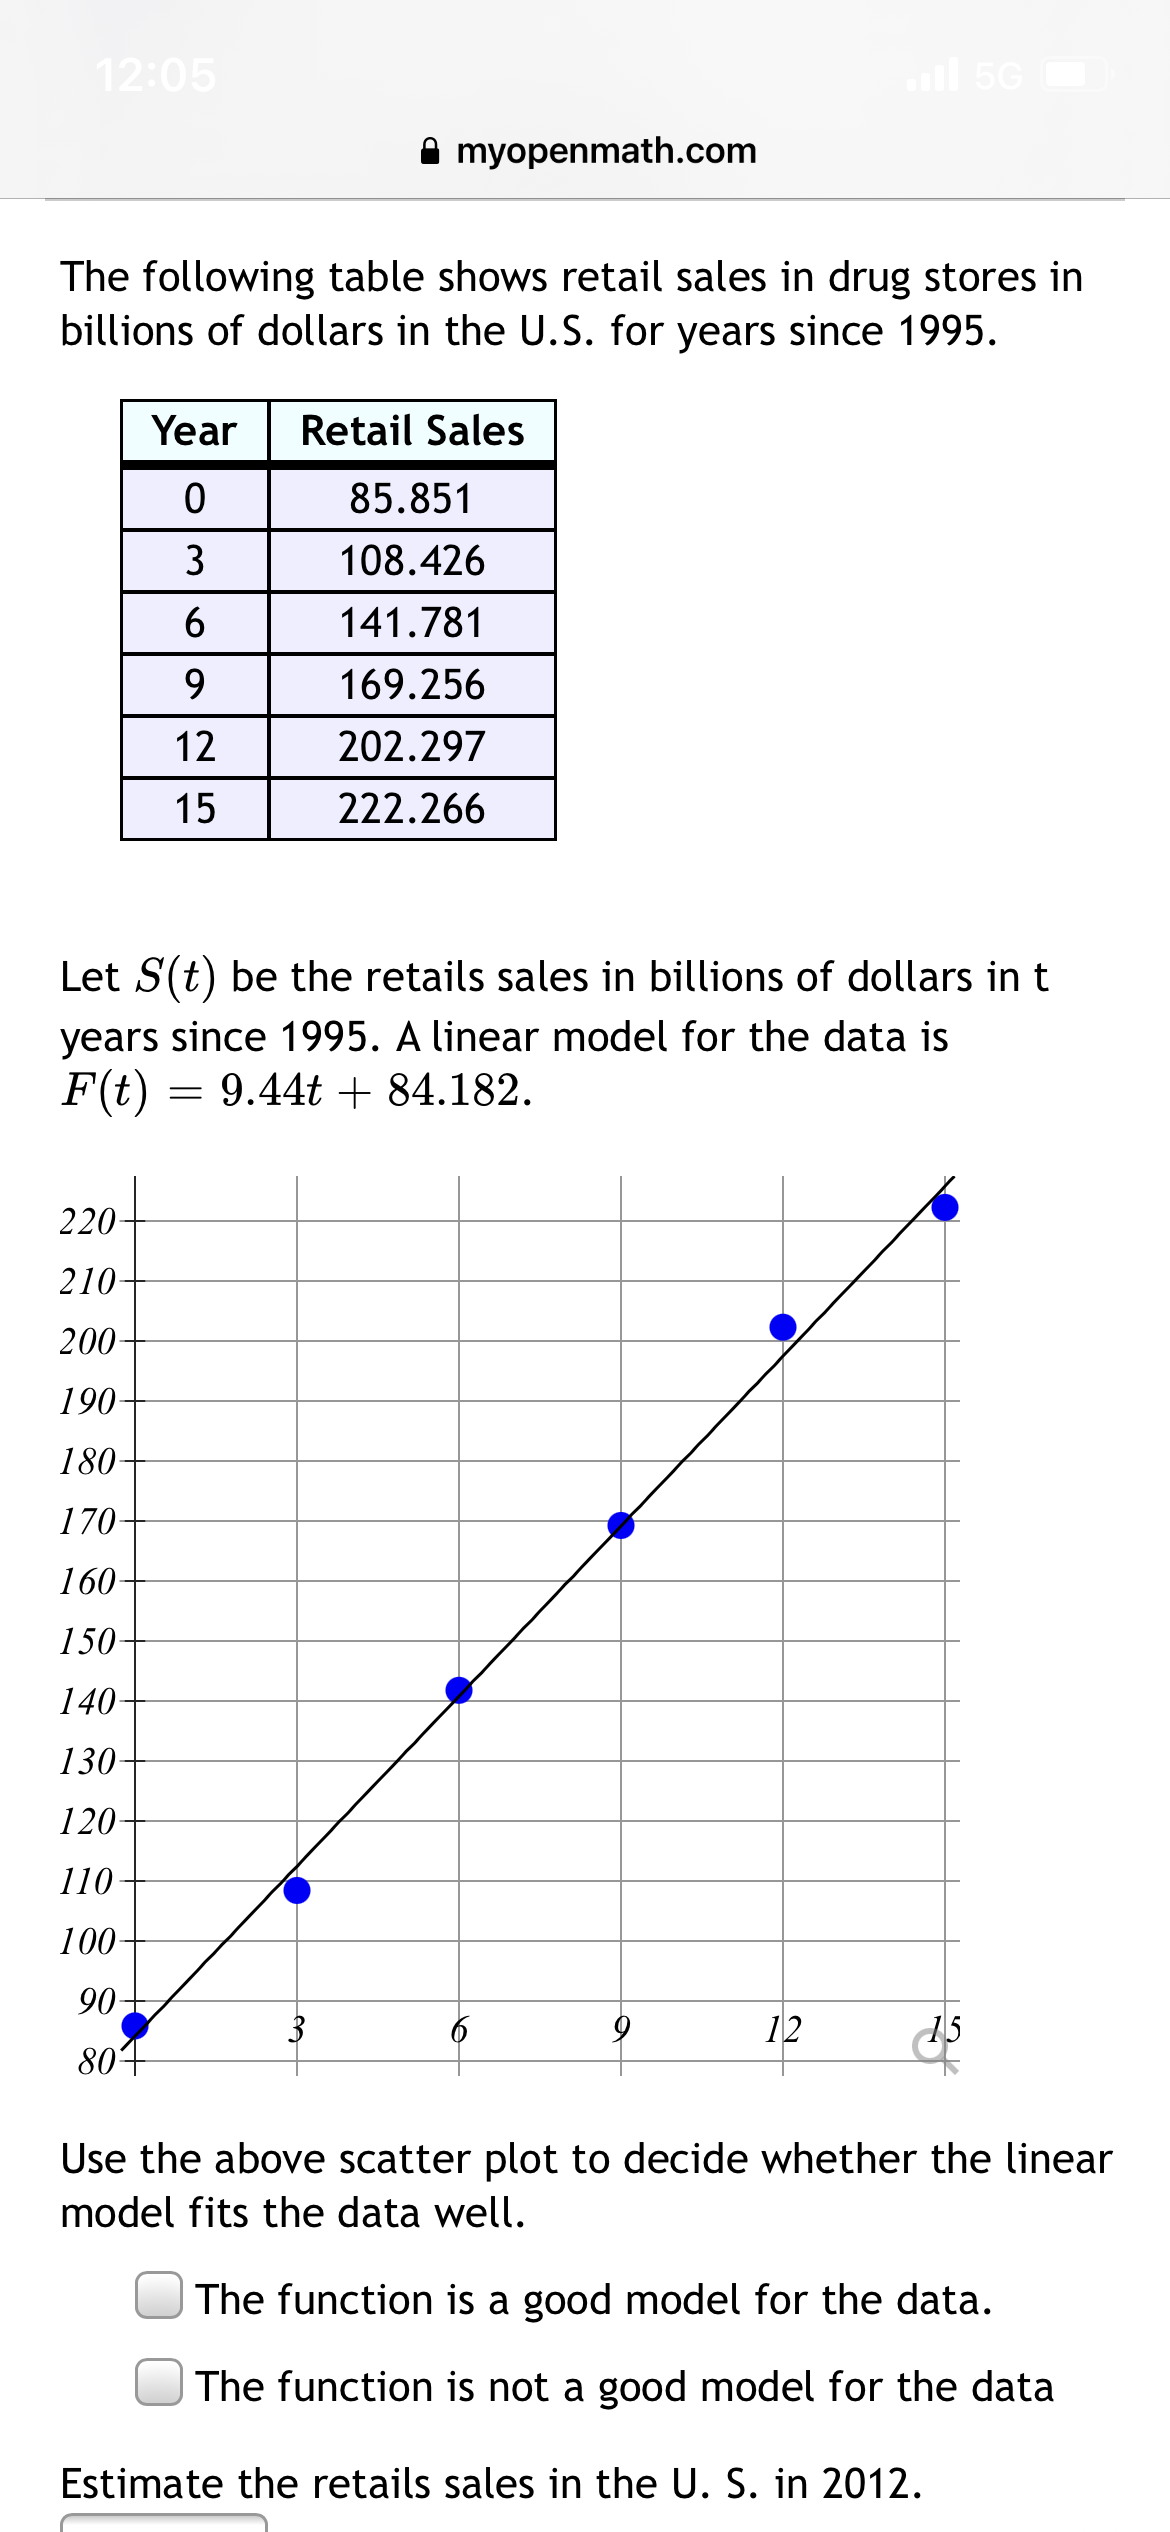
The following table shows retail sales in drug stores in
billions of dollars in the U.S. for years since 1995.
Year
Retail Sales
85.851
3
108.426
141.781
9.
169.256
12
202.297
15
222.266
Let S(t) be the retails sales in billions of dollars in t
years since 1995. A linear model for the data is
F(t)
= 9.44t + 84.182.
220-
210-
200-
190
180
170-
160-
150
140
130
120-
110
100
90
3
12
15
804
Use the above scatter plot to decide whether the linear
model fits the data well.
The function is a good model for the data.
The function is not a good model for the data
Estimate the retails sales in the U. S. in 2012.
Transcribed Image Text:12:05
ll 5G
A myopenmath.com
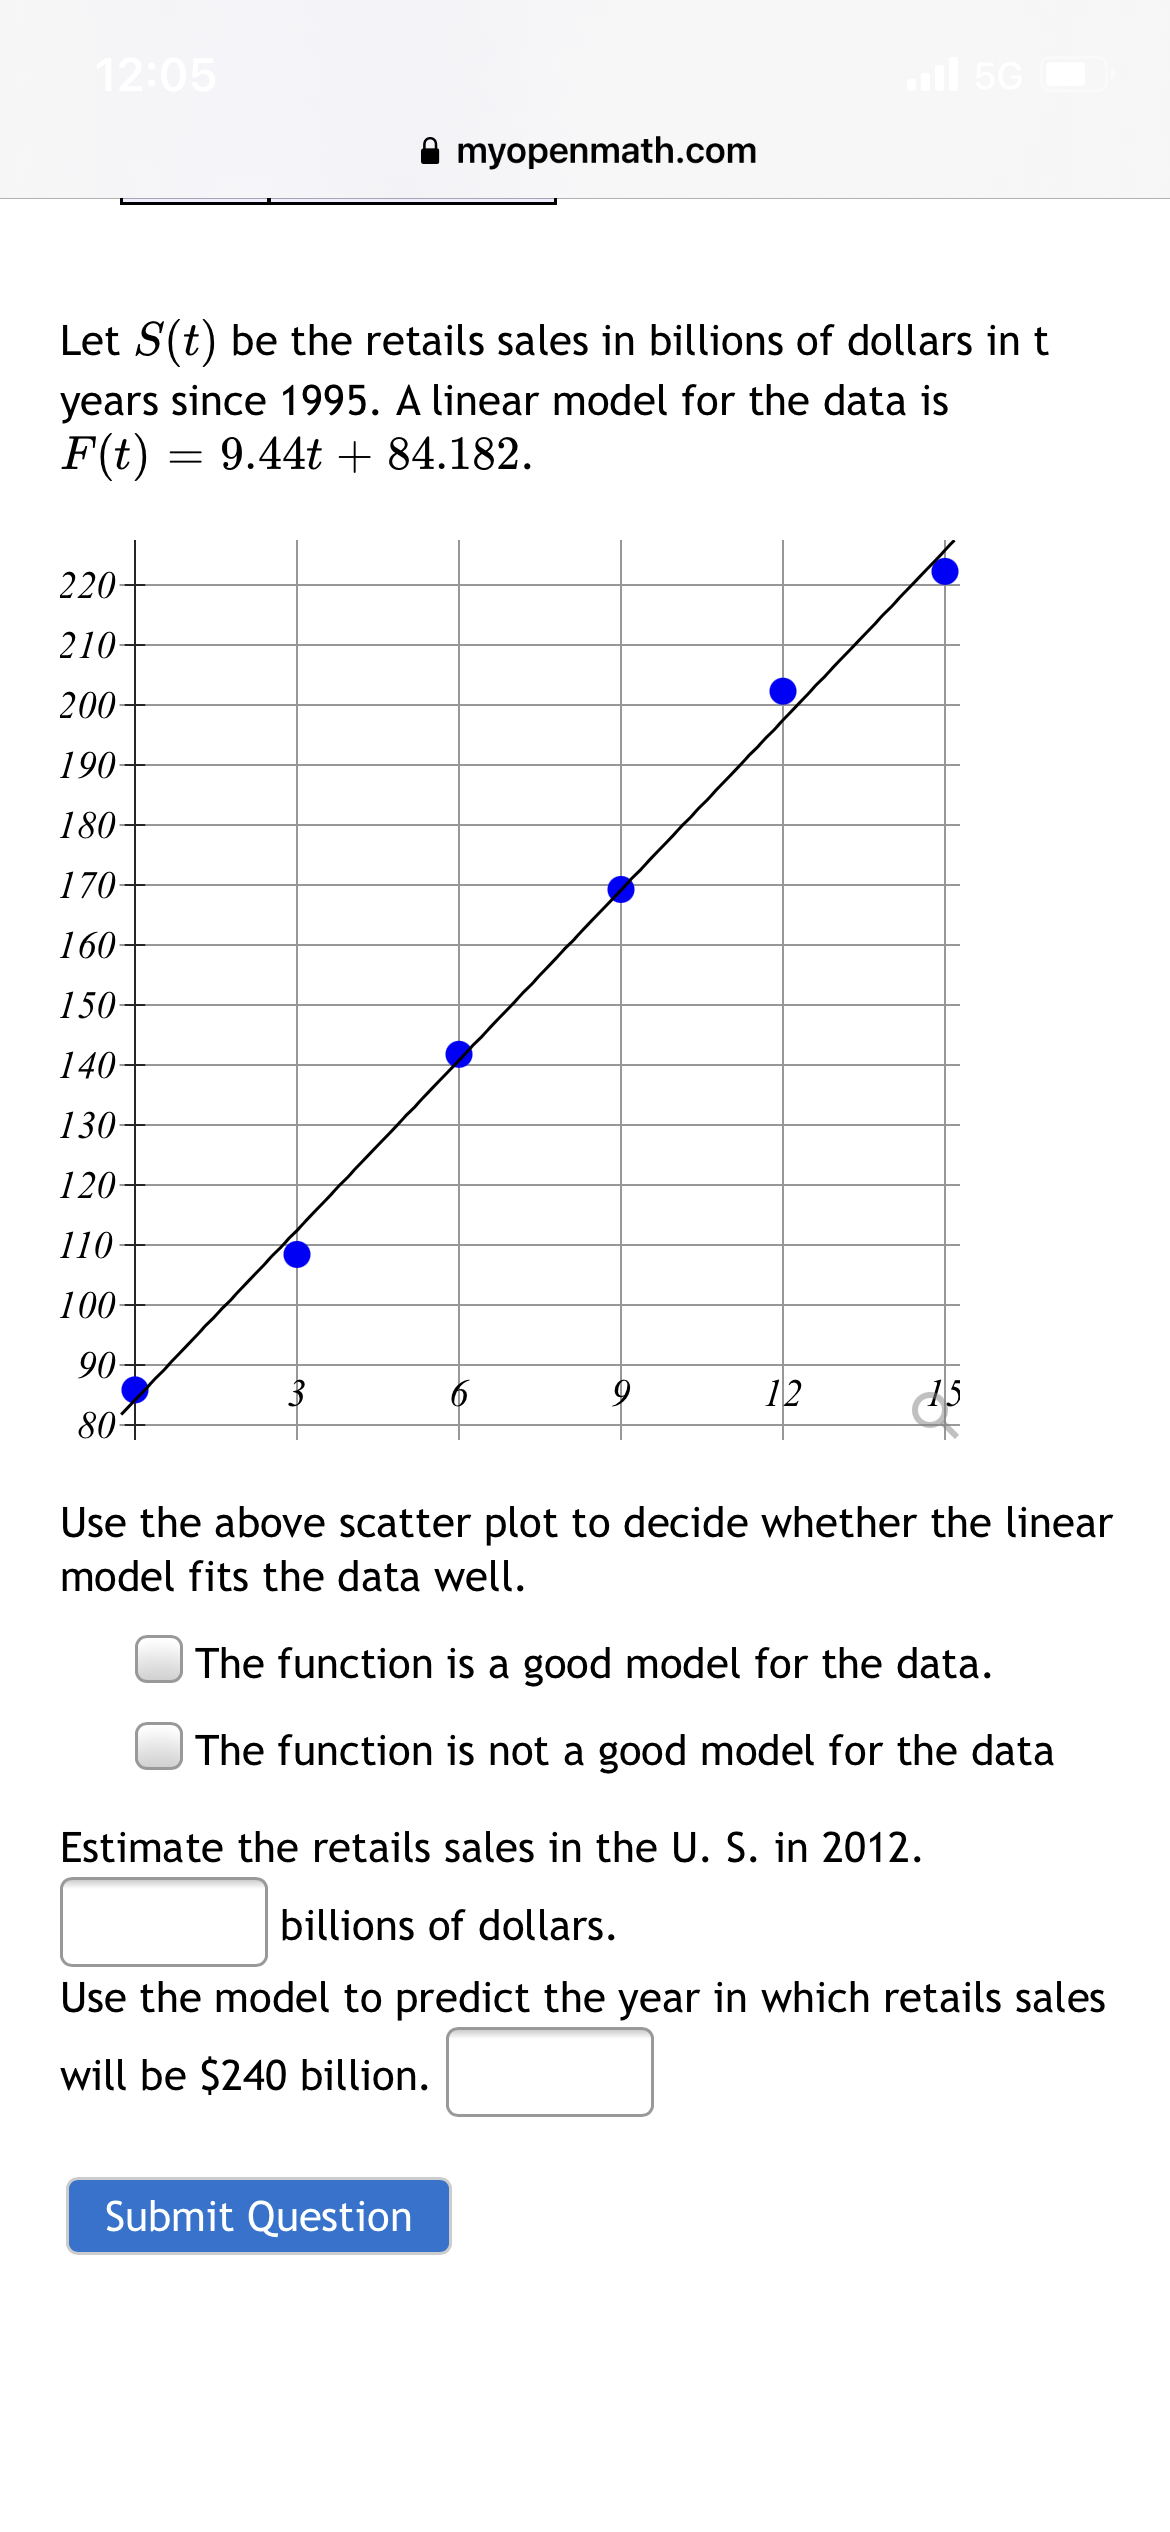
Let S(t) be the retails sales in billions of dollars in t
years since 1995. A linear model for the data is
F(t) = 9.44t + 84.182.
220-
210-
200
190
180-
170-
160
150
140
130-
120-
110
100
90
3
12
15
804
Use the above scatter plot to decide whether the linear
model fits the data well.
The function is a good model for the data.
The function is not a good model for the data
Estimate the retails sales in the U. S. in 2012.
billions of dollars.
Use the model to predict the year in which retails sales
will be $240 billion.
Submit Question
Expert Solution
This question has been solved!
Explore an expertly crafted, step-by-step solution for a thorough understanding of key concepts.

This is a popular solution!

Trending now
This is a popular solution!

Step by step
Solved in 4 steps

Recommended textbooks for you
Functions and Change: A Modeling Approach to Coll…
Algebra
ISBN:
9781337111348
Author:
Bruce Crauder, Benny Evans, Alan Noell
Publisher:
Cengage Learning
Functions and Change: A Modeling Approach to Coll…
Algebra
ISBN:
9781337111348
Author:
Bruce Crauder, Benny Evans, Alan Noell
Publisher:
Cengage Learning