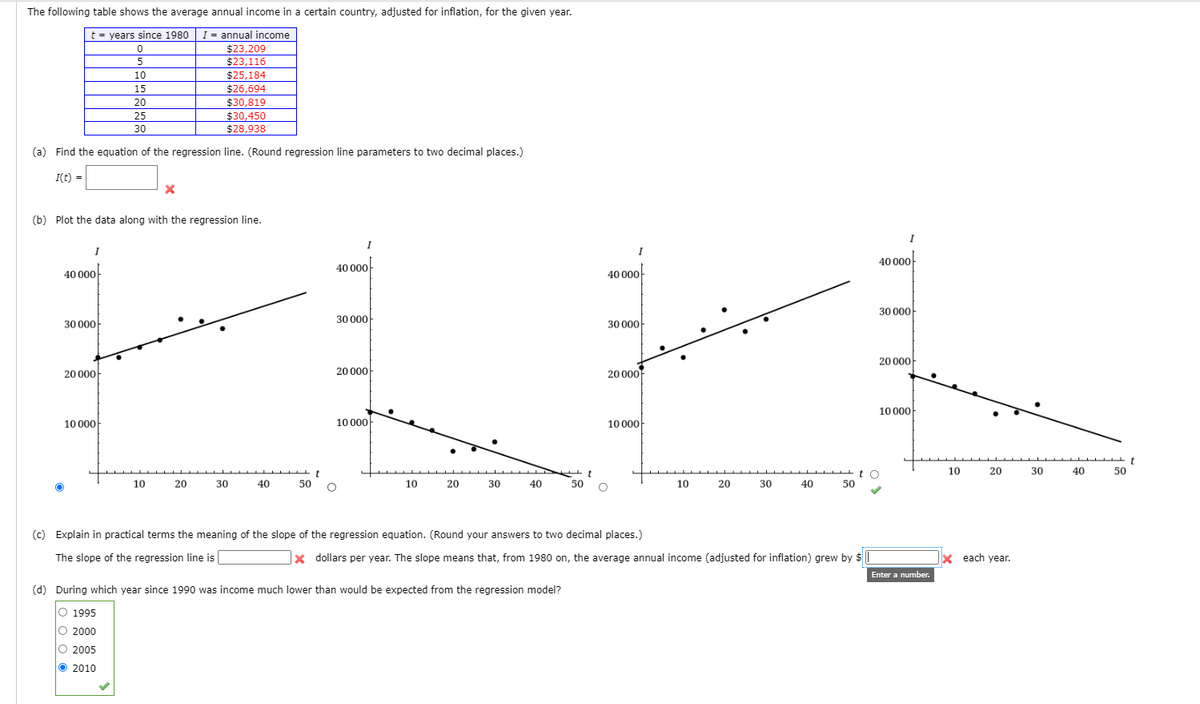
The following table shows the average annual income in a certain country, adjusted for inflation, for the given year. t- years since 1980 I = annual income $23,209 $23,116 $25,184 $26,694 $30,819 $30,450 $28,938 10 15 20 25 30 (a) Find the equation of the regression line. (Round regression line parameters to two decimal places.) I(t) -


Permutations and Combinations
If there are 5 dishes, they can be relished in any order at a time. In permutation, it should be in a particular order. In combination, the order does not matter. Take 3 letters a, b, and c. The possible ways of pairing any two letters are ab, bc, ac, ba, cb and ca. It is in a particular order. So, this can be called the permutation of a, b, and c. But if the order does not matter then ab is the same as ba. Similarly, bc is the same as cb and ac is the same as ca. Here the list has ab, bc, and ac alone. This can be called the combination of a, b, and c.
Counting Theory
The fundamental counting principle is a rule that is used to count the total number of possible outcomes in a given situation.
Please answer parts a and c.


Trending now
This is a popular solution!

Step by step
Solved in 2 steps with 11 images


