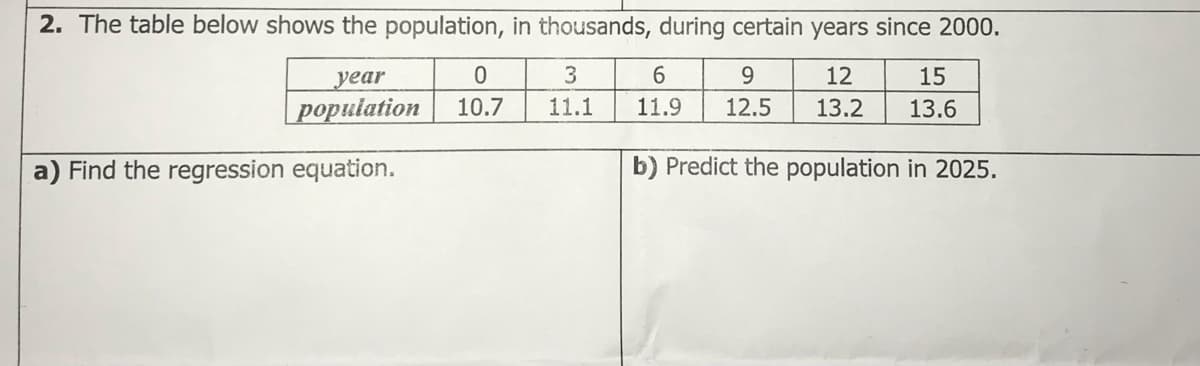
2. The table below shows the population, in thousands, during certain years since 2000. уear 3 6. 9. 12 15 рорulation 10.7 11.1 11.9 12.5 13.2 13.6 a) Find the regression equation. b) Predict the population in 2025.


Q: 2. The following data show the age of a car and its average mileage/liter. Age (in years) 2 3 6.…
A: In the given context, consider Age as x and Mileage/Liter as y.
Q: model involving 30 observations, the following estimated regression equation was obtained. ŷ = 170…
A: We know that the regression model is y^=β0+β1x+β2x2 where β0 is constant β1 is the coefficient on…
Q: 1. The table below shows the number of people, p, and suitcases, s, on 8 airplanes 63 115 153 192…
A:
Q: he table shows the age of a painting (x) in years, and its estimated dollar value (y). x2 y 1,200…
A:
Q: The number of initial public offerings of stock issued in a 10-year period and the total proceeds of…
A: (a). Given, n=10 The table below shows the required calculation: x y xy x2 y2 415 18867…
Q: The table below shows the number of state-registered automatic weapons and the murder rate for…
A: the regression equation in y = ax + b a-slope of the regression line. b - intercept of the…
Q: 2 In the simple linear regression model y = Bo + Bjx + u, suppose that E(u) + 0. Letting a, = E(u),…
A: Introduction: The existing linear regression model is: y = β0 + β1 x + u. Here, E (u) ≠ 0, but E (u)…
Q: The following linear regression model predicts a person's height (cm) from the length of their shoe…
A: given linear regression model is Height = 3.5 x shoe print + 80 predicted height = ? shoe print =…
Q: The following table shows the annual number of PhD graduates in a country in various fields.…
A: Excel output:
Q: The following table shows the annual family income of the students enrolled in the JRMSU-TC and…
A: Solution-: Let, X=Annual family income (Pesos) (in '000) and Y=General weighted average (%) We have…
Q: Please answer parts iv and v
A: 4) more education implies less predicted time spent in sleeping because variable "educ" has negative…
Q: The table below shows the number of state-registered automatic weapons and the murder rate for…
A: Find Regression line equations from the following data, also Estimate y when x = 9.8 and x=5.2 X…
Q: 4. The table below shows the mileage, m, on six cars that were recently traded in, along with their…
A: In this case, value of car is predicted on the basis of mileage. The value of car is dependent…
Q: Consider the following estimated regression equation: y' = 5.2 - 10.3x If (x = 10, y = -100) was one…
A:
Q: 3. Consider the following regression model: Weekly Hours = Bo + B1 × Wage + uj Weekly Hours is the…
A: Given information: The regression model is given.
Q: the table below shows the number of state-registered automatic weapons and the murder rate for…
A:
Q: A researcher is interested in learning how strong is the association be- tween the sodium intake and…
A:
Q: 2) The accompanying table shows the percent of the adult population that married before age 25 in…
A: Given: From the above table X is years and Y is percent. Sum of X…
Q: According to the summary result of linear regression model between A and B obtained from R given…
A: Simple linear Regression equation: It deals with one dependent variable and one independent…
Q: The following are data on the average weekly profits(in $1,000) of five restaurants, their seating…
A: Software procedure for regression in EXCEL. Enter the given data in EXCEL sheet. Go to Data >…
Q: The following chart shows estimated January retail inventories in the United States in 2000, 2005,…
A: The required value will provide by the following table: The regression line is, Y = b0 + b1 t
Q: Which of the following does NOT indicate a clear violation of the assumptions for linear regression…
A: In linear regression is the linear method to model the relation between dependent variable and one…
Q: The following table shows the age (X) and blood pressure (Y) of 8 persons : X: 52 63 45 36 72 65 47…
A:
Q: 1- Find attached the following data: Year 1990 1991 1992 1993 1994 Sales 5 3 10 - Calculate the…
A: Formulas and function in Excel.
Q: The following data give the percentage of women working in five companies in the retail and trade…
A:
Q: The table below shows the number of state-registered automatic weapons and the murder rate for…
A:
Q: (7) Consider the model log(wage) = 2.289 – .357 female + .50 totcoll + .030 female · totcoll (.003)…
A: i) Given, totcoll=2 years, female=1 (for a woman) Predicted log…
Q: The table below shows the number of state-registered automatic weapons and the murder rate for…
A: From given data, X Y X*Y X*X 11.3 13.9 157.07 127.69 8.2 10.7 87.74 67.24 7.1 10.3 73.13…
Q: 3. The following data were collected during an experiment in which laboratory animals were…
A: 3. It is been asked to find the simple linear regression using the given data.
Q: The following data give the percentage of women working in five companies in the retail and trade…
A: For the given data a. Develop the estimated regression equation by computing the values b0 and b1 b.…
Q: Given are five observations for two variables, x and y. xi 3 12 6 20 14 yi 55 45 50 15 20 #1)…
A:
Q: regression model involving 30 observations, the following estimated regression equation was…
A: Given that The regression equation was obtained.ŷ = 170 + 34x1 – 3x2 + 8x3 + 58x4 + 3x5 SSR = 1740…
Q: The table below shows the number of state-registered automatic weapons and the murder rate for…
A:
Q: Consider the following population linear regression model of individual food expenditure: Y = 50 +…
A:
Q: a) Compute the linear regression line y=bo+b₁x b) What is the estimated value, y for x = 7?
A: Given: Number of pairs of observations, n=9 X Y 1 16 2 23 3 35 4 28 5 44 6 40 7 22…
Q: The table below shows the number of state-registered automatic weapons and the murder rate for…
A: We want to fit a regression line (1) at X=10.8, we want to find Y (2) at X=4.4, we want to find Y
Q: The following table shows the annual sales revenue of 12 firms and their expenditure on the market…
A: Procedure to conduct regression analysis using Excel: Enter the data of expenditure on market…
Q: 2. Following are data on the worldwide shipments of personal computers (in thousands) according to…
A: solution: (a) The linear model is: y = -5391.9341 + 6115.591x The fitted values are residuals are:…
Q: The table below shows the numbers of new-vehicle sales (in thousands) for Company 1 and Company 2…
A:
Q: The table below shows the number of state-registered automatic weapons and the murder rate for…
A: x y xy x2 11.7 13.8 161.46 136.89 8.1 10.7 86.67 65.61 6.7 9.9 66.33 44.89 3.3 6.6…
Q: The table below shows the number of state-registered automatic weapons and the murder rate for…
A: Given, x y 11.9 14 8.4 11.1 6.8 9.6 3.8 7.3 2.9 6.7 2.7 6.5 2.6 6.3 0.5 4.7
Q: A well-known university is interested in how salary (in thousands of dollars) is predicted from…
A: Given regression equations are : Faculty (n = 170): ŷ = 60 + 1.1x Admin. (n = 155): ŷ = 57 + 1.5x
Q: The table below shows the number of state-registered automatic weapons and the murder rate for…
A: The question is about regression Given : To find : 1 ) Reg. eq 2 ) a ) How many murders per…
Q: The following model is a simplified version of the multiple regression model used by Biddle and…
A: Part 1: More work implies less sleep so in the given model if sleep is compromised for work then…
Q: The following table lists the midterm and final exam scores for seven students in a statistics…
A: In this case, final exam scores is predicted on the basis of midterm exam scores. The final exam…
Q: Suppose we carry out a linear regression analysis with the following model: Y = Bo + B1X1 + .. +…
A: The given values are SSReg=74.1,SSTotal=972.5.
Q: The following data give the percentage of women working in five companies in the retail and trade…
A: Linear regression equation is a equation that is used to predict the relation between two variables…
Q: Assume there is a positive linear correlation between the variable R (Return rate in percent of a…
A:
Q: 1. The following is an image of a Cartesian diagram. y (3, 4) (5, 4) (3, 3) (6, 3) (3, 2) 2. (1, 1)…
A: Given information: The cartesian diagram is given.


Trending now
This is a popular solution!

Step by step
Solved in 2 steps with 1 images

- The following fictitious table shows kryptonite price, in dollar per gram, t years after 2006. t= Years since 2006 0 1 2 3 4 5 6 7 8 9 10 K= Price 56 51 50 55 58 52 45 43 44 48 51 Make a quartic model of these data. Round the regression parameters to two decimal places.Olympic Pole Vault The graph in Figure 7 indicates that in recent years the winning Olympic men’s pole vault height has fallen below the value predicted by the regression line in Example 2. This might have occurred because when the pole vault was a new event there was much room for improvement in vaulters’ performances, whereas now even the best training can produce only incremental advances. Let’s see whether concentrating on more recent results gives a better predictor of future records. (a) Use the data in Table 2 (page 176) to complete the table of winning pole vault heights shown in the margin. (Note that we are using x=0 to correspond to the year 1972, where this restricted data set begins.) (b) Find the regression line for the data in part ‚(a). (c) Plot the data and the regression line on the same axes. Does the regression line seem to provide a good model for the data? (d) What does the regression line predict as the winning pole vault height for the 2012 Olympics? Compare this predicted value to the actual 2012 winning height of 5.97 m, as described on page 177. Has this new regression line provided a better prediction than the line in Example 2?Repeat Example 5 when microphone A receives the sound 4 seconds before microphone B.
- .The worker has noticed that the more time he spends at work (x), the less money he is likely to make (y) in conducting transactions for his firm. Which of the regression equations MOST suggests such a possibility?The table below shows the number of state-registered automatic weapons and the murder rate for several Northwestern states. xx 11.7 8.6 6.7 3.5 2.3 2.6 2.2 0.7 yy 14 11 10 7 6.1 6.4 5.9 4.3 xx = thousands of automatic weaponsyy = murders per 100,000 residentsDetermine the regression equation in y = ax + b form and write it below. (Round to 2 decimal places) A) How many murders per 100,000 residents can be expected in a state with 6.5 thousand automatic weapons? Answer = Round to 3 decimal places. B) How many murders per 100,000 residents can be expected in a state with 11 thousand automatic weapons? Answer = Round to 3 decimal places.the table below shows the number of state-registered automatic weapons and the murder rate for several Northwestern states. xx 11.6 8.6 7 3.5 2.9 2.2 2.3 0.6 yy 14.2 11.4 9.7 7.2 6.6 5.9 5.7 4.3 x = thousands of automatic weaponsy = murders per 100,000 residentsDetermine the regression equation in y = ax + b form and write it below. (Round to 3 decimal places) A) How many murders per 100,000 residents can be expected in a state with 6.2 thousand automatic weapons? Answer = Round to 3 decimal places. B) How many murders per 100,000 residents can be expected in a state with 3.8 thousand automatic weapons? Answer = Round to 4 decimal places.
- 2.state each of the five assumptions of the classical regression model (OLS) and give an intuitive explanation of the meaning and need for each of themAssume that there is a positive linear correlation between the variable R (return rate in percent of financial investment) and the variable t (age in years of the investment) given by the regression equation R = 2.5t + 5.3. 1- Without further information, can we assume there is a cause-and-effect relationship between the return rate and the age of the investment? 2- If the investment continues to grow at a constant rate, what is the expected return rate when the investment is 7 years old? 3- If the investment continues to grow at a constant rate, how old is the investment when the return rate is 32.8%?If other factors are held constant, if the Pearson correlation between X and Y is r = 0.50, then the regression equation will produce more accurate predictions than would be obtained if r = 0.70. True or false?
- If the general linear regression model is given by the equation: y = a + b?; considering the informationobtained in Figure 2 above, compute the value of a.(a) For United States, provide data for the variables below over the years 1993 –2007:(i) Net migration rate (per 1,000 population)(ii) Total fertility rate (live births per woman)(iii)Unemployment, general level (Thousands)(iv) Wages(v) Life expectancy at birth for both sexes combined (years)Data can be obtained from the UN database http://data.un.org/Explorer.aspxUsing R-Studio, estimate a regression equation to determine the effect of unemployment,general level, wages and life expectancy at birth for both sexes on the net migration rate.(All codes and regression output should be provided).(i) Write down the regression equation. (ii) Interpret the coefficients and determine which of the individual coefficients in theregression model are statistically significant. In responding, construct and test anyappropriate hypothesis. (iii) Interpret the coefficient of determination.a) For United States, provide data for the variables below over the years 1993 – 2007: (i) Net migration rate (per 1,000 population) (ii) Total fertility rate (live births per woman) (iii)Unemployment, general level (Thousands) (iv) Wages (v) Life expectancy at birth for both sexes combined (years) Data can be obtained from the UN database http://data.un.org/Explorer.aspx Using R-Studio, estimate a regression equation to determine the effect of unemployment, general level, wages and life expectancy at birth for both sexes on the net migration rate. (All codes and regression output should be provided).(i) Write down the regression equation. (ii) Interpret the coefficients and determine which of the individual coefficients in theregression model are statistically significant. In responding, construct and test anyappropriate hypothesis. (iii) Interpret the coefficient of determination. (iv) Using the 10% level of significance, determine and discuss whether the overallregression equation…

