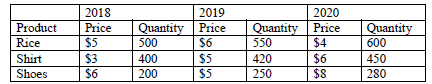
The following table shows the outputs and prices of three products produced by an economy in 2018, 2019 and 2020. (i) Measure the nominal GDP, the real GDP and the GDP deflator in 2019 and 2020, taking 2018 as the base year. (ii) Using the GDP deflator, measure the inflation rate in the economy between 2018 and 2019, and also between 2019 and 2020. (iii) Assume all household consumption items are locally produced as shown in the table in Question (a). A typical household in the economy consumes 5 units of rice, 4 units of shirt and 2 units of shoes in 2018. Using 2018 as the base year, measure the CPI for 2019 and 2020 and the inflation rate between 2018 and 2019, and also between 2019 and 2020. Explain why the inflation rate is different from those computed from (a)(ii).


The following table shows the outputs and prices of three products produced by an economy in 2018, 2019 and 2020.
(i) Measure the nominal
(ii) Using the GDP deflator, measure the inflation rate in the economy between 2018 and 2019, and also between 2019 and 2020.
(iii) Assume all household consumption items are locally produced as shown in the table in Question (a). A typical household in the economy consumes 5 units of rice, 4 units of shirt and 2 units of shoes in 2018. Using 2018 as the base year, measure the


Trending now
This is a popular solution!

Step by step
Solved in 3 steps with 1 images


