The following table summarizes the income distribution for the town of Perkopia, which has a population of 10,000 people. Every individual within an income group earns the same income, and the total annual income in the economy is $500,000,000. Suppose that in 2010, the poverty income threshold, or poverty line, is set at an annual income of $42,350 for an individual. Year 2006 2010 2016 2020 Lowest Quintile 3.0 3.4 3.8 5.0 Quintile Lowest Second Middle Fourth Highest The data in the table suggest that there was Second Quintile 8.6 9.4 9.7 11.0 Share of Total Income in Perkopia (Percent) Middle Quintile Fourth Quintile 14.0 14.6 15.2 15.5 Share of Income in 2010 (Percent) 3.4 9.4 14.6 22.4 50.2 21.9 22.4 22.9 25.0 Total Income (Dollars) Complete the following table to help you determine the poverty line in Perkopia in 2010. To do this, begin by determining the total income of all individuals in each quintile, using the fact that total annual income in the economy is $500,000,000. Next, determine the income of an individual in each quintile by dividing the total income of that quintile by the number of people in that quintile. (Hint: Recall that Perkopia has a population of 10,000 people.) Finally, determine whether the individual income for each quintile falls below the poverty income threshold, or poverty line, of $42,350. Highest Quintile income inequality from 2006 to 2020. 52.5 50.2 48.4 43.5 Individual Income (Dollars) Below Poverty Line? □□□□□□□□□□□
The following table summarizes the income distribution for the town of Perkopia, which has a population of 10,000 people. Every individual within an income group earns the same income, and the total annual income in the economy is $500,000,000. Suppose that in 2010, the poverty income threshold, or poverty line, is set at an annual income of $42,350 for an individual. Year 2006 2010 2016 2020 Lowest Quintile 3.0 3.4 3.8 5.0 Quintile Lowest Second Middle Fourth Highest The data in the table suggest that there was Second Quintile 8.6 9.4 9.7 11.0 Share of Total Income in Perkopia (Percent) Middle Quintile Fourth Quintile 14.0 14.6 15.2 15.5 Share of Income in 2010 (Percent) 3.4 9.4 14.6 22.4 50.2 21.9 22.4 22.9 25.0 Total Income (Dollars) Complete the following table to help you determine the poverty line in Perkopia in 2010. To do this, begin by determining the total income of all individuals in each quintile, using the fact that total annual income in the economy is $500,000,000. Next, determine the income of an individual in each quintile by dividing the total income of that quintile by the number of people in that quintile. (Hint: Recall that Perkopia has a population of 10,000 people.) Finally, determine whether the individual income for each quintile falls below the poverty income threshold, or poverty line, of $42,350. Highest Quintile income inequality from 2006 to 2020. 52.5 50.2 48.4 43.5 Individual Income (Dollars) Below Poverty Line? □□□□□□□□□□□

Principles of Economics 2e
2nd Edition
ISBN:9781947172364
Author:Steven A. Greenlaw; David Shapiro
Publisher:Steven A. Greenlaw; David Shapiro
Chapter15: Poverty And Economic Inequality
Section: Chapter Questions
Problem 6SCQ: A group 0f 10 people have the following annual incomes:...

Related questions
Question
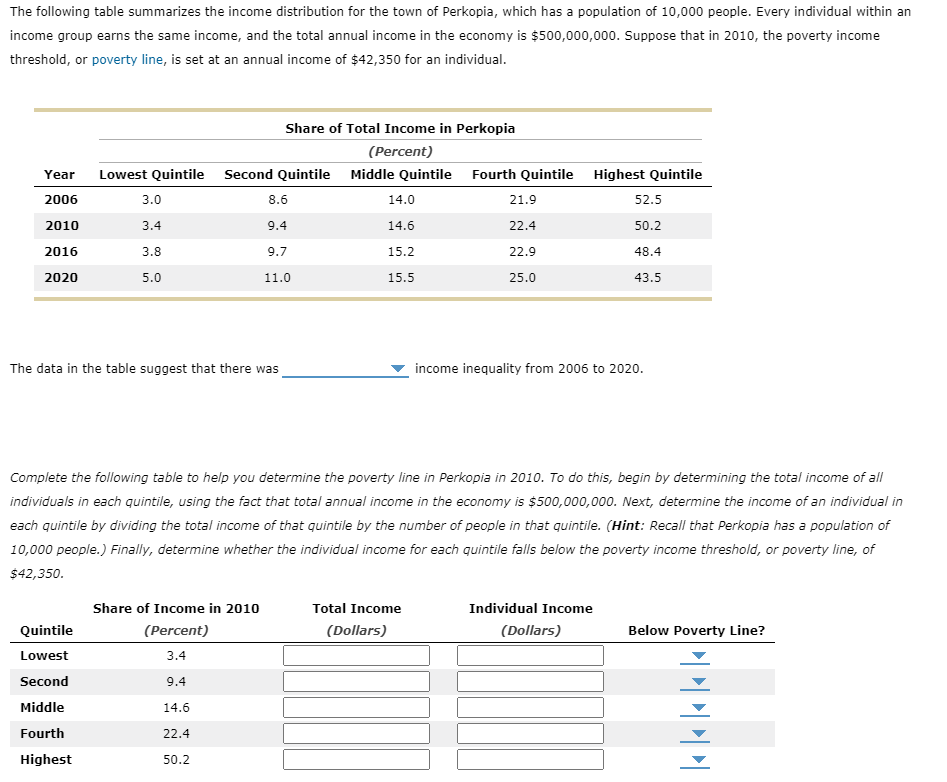
Transcribed Image Text:The following table summarizes the income distribution for the town of Perkopia, which has a population of 10,000 people. Every individual within an
income group earns the same income, and the total annual income in the economy is $500,000,000. Suppose that in 2010, the poverty income
threshold, or poverty line, is set at an annual income of $42,350 for an individual.
Year
2006
2010
2016
2020
Quintile
Lowest
Lowest Quintile Second Quintile
3.0
3.4
3.8
5.0
The data in the table suggest that there was
Second
Middle
Fourth
Highest
Share of Total Income in Perkopia
(Percent)
Middle Quintile Fourth Quintile Highest Quintile
8.6
9.4
9.7
11.0
Share of Income in 2010
(Percent)
3.4
9.4
14.6
22.4
50.2
14.0
14.6
15.2
15.5
Complete the following table to help you determine the poverty line in Perkopia in 2010. To do this, begin by determining the total income of all
individuals in each quintile, using the fact that total annual income in the economy is $500,000,000. Next, determine the income of an individual in
each quintile by dividing the total income of that quintile by the number of people in that quintile. (Hint: Recall that Perkopia has a population of
10,000 people.) Finally, determine whether the individual income for each quintile falls below the poverty income threshold, or poverty line, of
$42,350.
21.9
22.4
22.9
25.0
Total Income
(Dollars)
income inequality from 2006 to 2020.
52.5
50.2
48.4
43.5
Individual Income
(Dollars)
Below Poverty Line?
PPPPPI
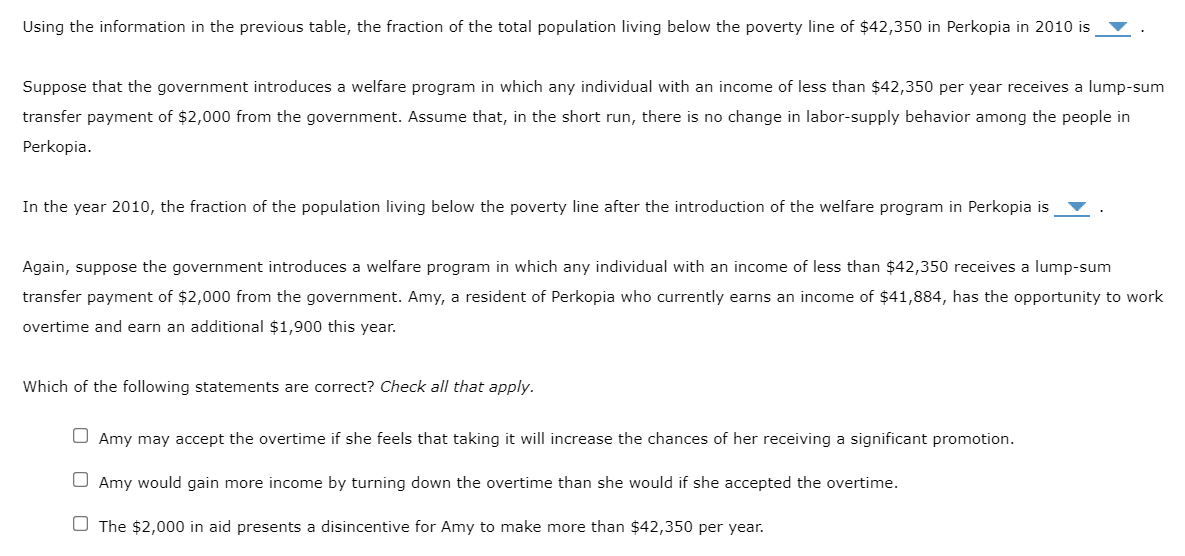
Transcribed Image Text:Using the information in the previous table, the fraction of the total population living below the poverty line of $42,350 in Perkopia in 2010 is
Suppose that the government introduces a welfare program in which any individual with an income of less than $42,350 per year receives a lump-sum
transfer payment of $2,000 from the government. Assume that, in the short run, there is no change in labor-supply behavior among the people in
Perkopia.
In the year 2010, the fraction of the population living below the poverty line after the introduction of the welfare program in Perkopia is
Again, suppose the government introduces a welfare program in which any individual with an income of less than $42,350 receives a lump-sum
transfer payment of $2,000 from the government. Amy, a resident of Perkopia who currently earns an income of $41,884, has the opportunity to work
overtime and earn an additional $1,900 this year.
Which of the following statements are correct? Check all that apply.
Amy may accept the overtime if she feels that taking it will increase the chances of her receiving a significant promotion.
O Amy would gain more income by turning down the overtime than she would if she accepted the overtime.
The $2,000 in aid presents a disincentive for Amy to make more than $42,350 per year.
Expert Solution
This question has been solved!
Explore an expertly crafted, step-by-step solution for a thorough understanding of key concepts.

This is a popular solution!

Trending now
This is a popular solution!

Step by step
Solved in 5 steps

Knowledge Booster


Learn more about
Need a deep-dive on the concept behind this application? Look no further. Learn more about this topic, economics and related others by exploring similar questions and additional content below.Recommended textbooks for you
Principles of Economics 2e
Economics
ISBN:
9781947172364
Author:
Steven A. Greenlaw; David Shapiro
Publisher:
OpenStax

Principles of Microeconomics
Economics
ISBN:
9781305156050
Author:
N. Gregory Mankiw
Publisher:
Cengage Learning

Principles of Economics 2e
Economics
ISBN:
9781947172364
Author:
Steven A. Greenlaw; David Shapiro
Publisher:
OpenStax
Principles of Microeconomics
Economics
ISBN:
9781305156050
Author:
N. Gregory Mankiw
Publisher:
Cengage Learning


