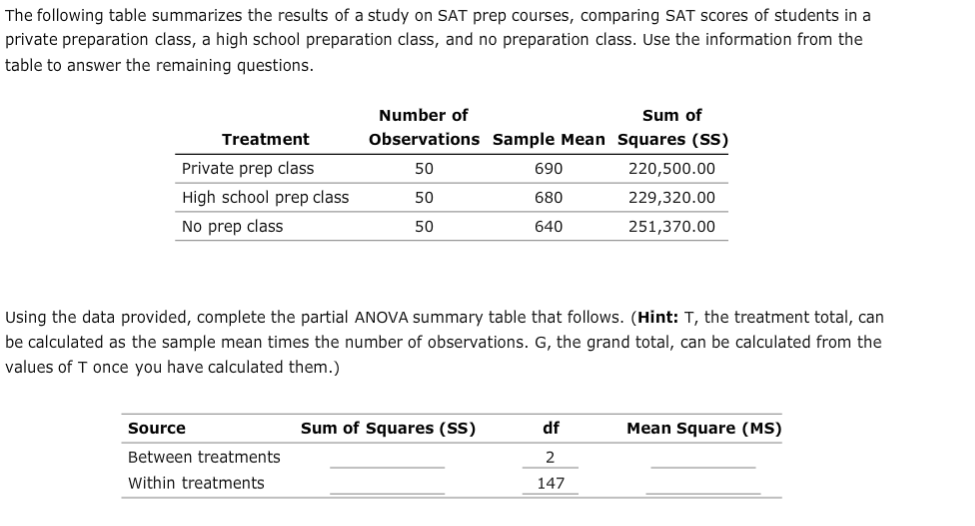
The following table summarizes the results of a study on SAT prep courses, comparing SAT scores of students in a private preparation class, a high school preparation class, and no preparation class. Use the information from the table to answer the remaining questions. Number of Sum of Treatment Observations Sample Mean Squares (SS) Private prep class 50 690 220,500.00 High school prep class 50 680 229,320.00 No prep class 50 640 251,370.00 Using the data provided, complete the partial ANOVA summary table that follows. (Hint: T, the treatment total, can be calculated as the sample mean times the number of observations. G, the grand total, can be calculated from the values of T once you have calculated them.) Source Sum of Squares (SS) df Mean Square (MS) Between treatments 2 Within treatments 147
The following table summarizes the results of a study on SAT prep courses, comparing SAT scores of students in a private preparation class, a high school preparation class, and no preparation class. Use the information from the table to answer the remaining questions. Number of Sum of Treatment Observations Sample Mean Squares (SS) Private prep class 50 690 220,500.00 High school prep class 50 680 229,320.00 No prep class 50 640 251,370.00 Using the data provided, complete the partial ANOVA summary table that follows. (Hint: T, the treatment total, can be calculated as the sample mean times the number of observations. G, the grand total, can be calculated from the values of T once you have calculated them.) Source Sum of Squares (SS) df Mean Square (MS) Between treatments 2 Within treatments 147

Glencoe Algebra 1, Student Edition, 9780079039897, 0079039898, 2018
18th Edition
ISBN:9780079039897
Author:Carter
Publisher:Carter
Chapter10: Statistics
Section10.3: Measures Of Spread
Problem 1GP

Related questions

Concept explainers
Ratios
A ratio is a comparison between two numbers of the same kind. It represents how many times one number contains another. It also represents how small or large one number is compared to the other.
Trigonometric Ratios
Trigonometric ratios give values of trigonometric functions. It always deals with triangles that have one angle measuring 90 degrees. These triangles are right-angled. We take the ratio of sides of these triangles.
Question
How do I use SS to find SSbetween and SSwithin?
Transcribed Image Text:The following table summarizes the results of a study on SAT prep courses, comparing SAT scores of students in a
private preparation class, a high school preparation class, and no preparation class. Use the information from the
table to answer the remaining questions.
Number of
Sum of
Treatment
Observations Sample Mean Squares (SS)
Private prep class
50
690
220,500.00
High school prep class
50
680
229,320.00
No prep class
50
640
251,370.00
Using the data provided, complete the partial ANOVA summary table that follows. (Hint: T, the treatment total, can
be calculated as the sample mean times the number of observations. G, the grand total, can be calculated from the
values of T once you have calculated them.)
Source
Sum of Squares (SS)
df
Mean Square (MS)
Between treatments
2
Within treatments
147
Expert Solution
This question has been solved!
Explore an expertly crafted, step-by-step solution for a thorough understanding of key concepts.

This is a popular solution!

Trending now
This is a popular solution!

Step by step
Solved in 2 steps with 5 images

Knowledge Booster


Learn more about
Need a deep-dive on the concept behind this application? Look no further. Learn more about this topic, statistics and related others by exploring similar questions and additional content below.Recommended textbooks for you
Glencoe Algebra 1, Student Edition, 9780079039897…
Algebra
ISBN:
9780079039897
Author:
Carter
Publisher:
McGraw Hill
Glencoe Algebra 1, Student Edition, 9780079039897…
Algebra
ISBN:
9780079039897
Author:
Carter
Publisher:
McGraw Hill