The following time series shows the sales of a particular product over the past 12 months. Month Sales 1 105 135 120 4 105 90 6. 120 145 8. 140 2. 3.
The following time series shows the sales of a particular product over the past 12 months. Month Sales 1 105 135 120 4 105 90 6. 120 145 8. 140 2. 3.

Algebra & Trigonometry with Analytic Geometry
13th Edition
ISBN:9781133382119
Author:Swokowski
Publisher:Swokowski
Chapter10: Sequences, Series, And Probability
Section10.3: Geometric Sequences
Problem 82E

Related questions
Question
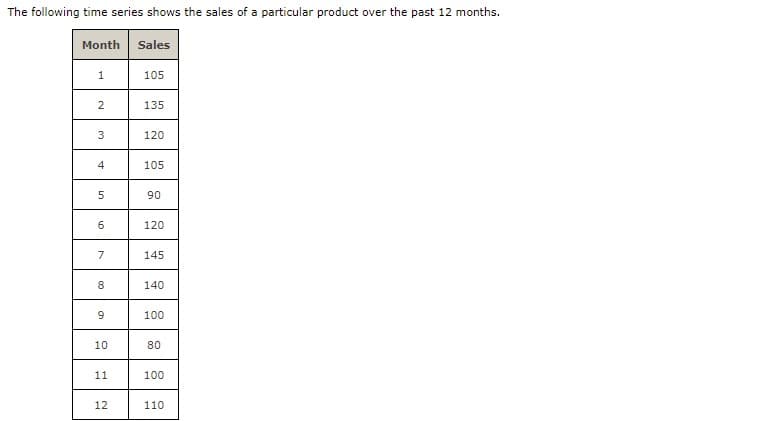
Transcribed Image Text:The following time series shows the sales of a particular product over the past 12 months.
Month Sales
1
105
2
135
3
120
4
105
90
120
7
145
8
140
100
10
80
11
100
12
110
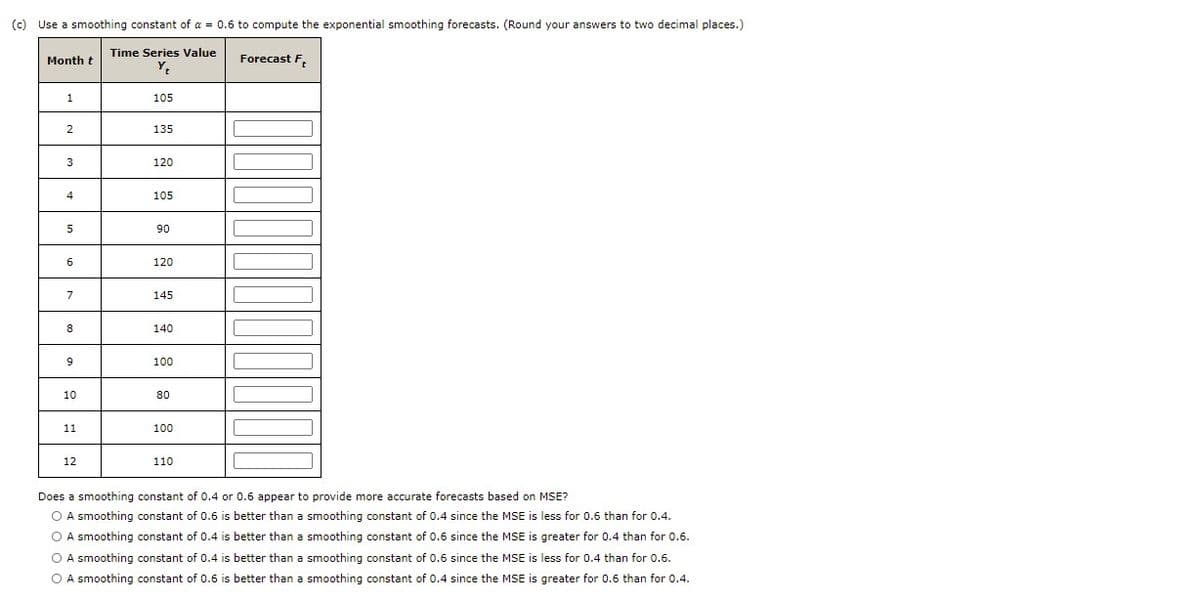
Transcribed Image Text:(c) Use a smoothing constant of a = 0.6 to compute the exponential smoothing forecasts. (Round your answers to two decimal places.)
Time Series Value
Month t
Forecast F,
1
105
135
3
120
105
5
90
6
120
7
145
8
140
9
100
10
80
11
100
12
110
Does a smoothing constant of 0.4 or 0.6 appear to provide more accurate forecasts based on MSE?
O A smoothing constant of 0.6 is better than a smoothing constant of 0.4 since the MSE is less for 0.6 than for 0.4.
O A smoothing constant of 0.4 is better than a smoothing constant of 0.6 since the MSE is greater for 0.4 than for 0.6.
O A smoothing constant of 0.4 is better than a smoothing constant of 0.6 since the MSE is less for 0.4 than for 0.6.
O A smoothing constant of 0.6 is better than a smoothing constant of 0.4 since the MSE is greater for 0.6 than for 0.4.
Expert Solution
This question has been solved!
Explore an expertly crafted, step-by-step solution for a thorough understanding of key concepts.

This is a popular solution!

Trending now
This is a popular solution!

Step by step
Solved in 3 steps with 1 images

Knowledge Booster


Learn more about
Need a deep-dive on the concept behind this application? Look no further. Learn more about this topic, statistics and related others by exploring similar questions and additional content below.Recommended textbooks for you
Algebra & Trigonometry with Analytic Geometry
Algebra
ISBN:
9781133382119
Author:
Swokowski
Publisher:
Cengage

Elementary Algebra
Algebra
ISBN:
9780998625713
Author:
Lynn Marecek, MaryAnne Anthony-Smith
Publisher:
OpenStax - Rice University
Algebra & Trigonometry with Analytic Geometry
Algebra
ISBN:
9781133382119
Author:
Swokowski
Publisher:
Cengage
Elementary Algebra
Algebra
ISBN:
9780998625713
Author:
Lynn Marecek, MaryAnne Anthony-Smith
Publisher:
OpenStax - Rice University