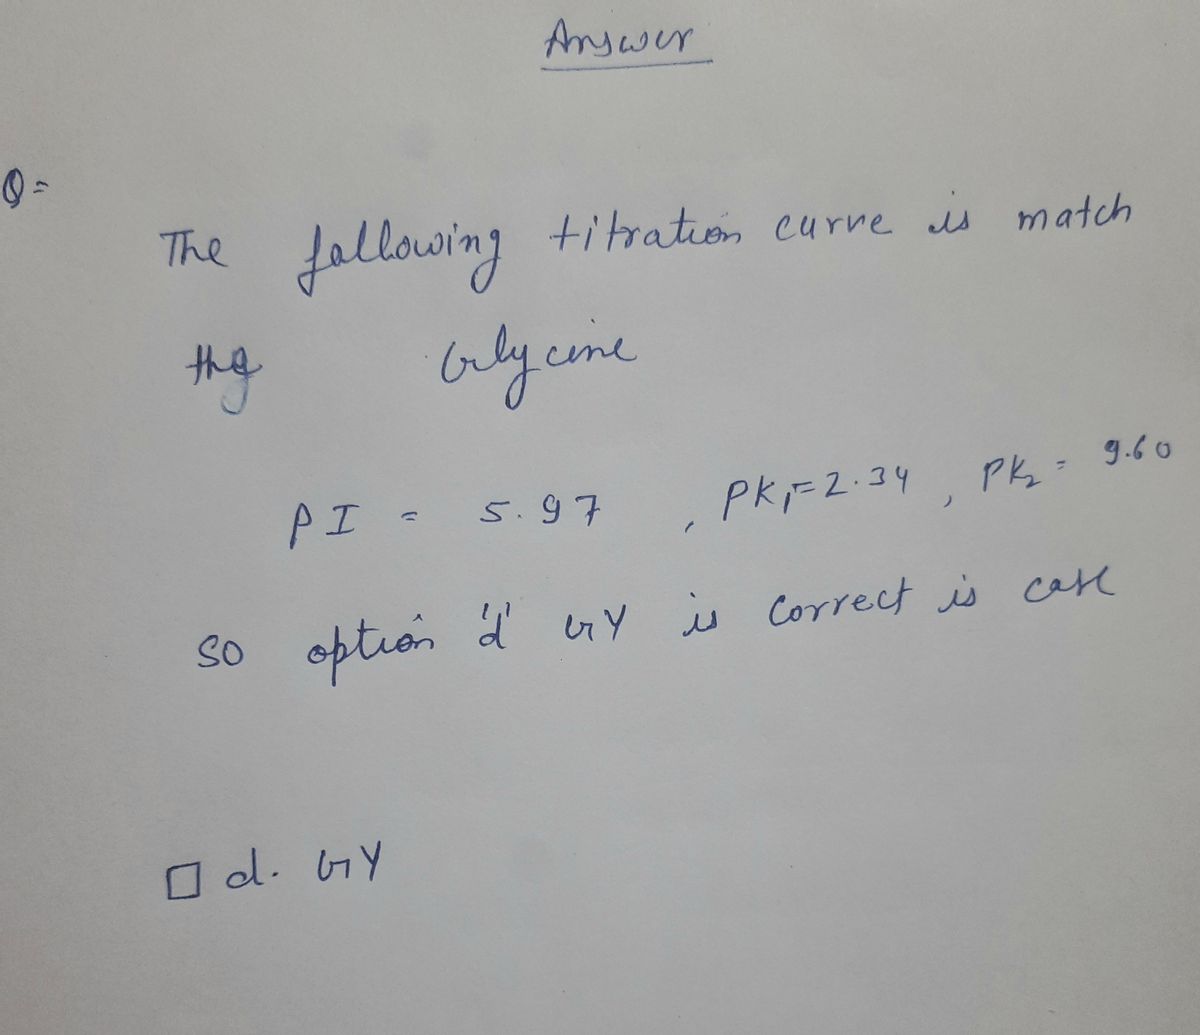
The following titration curve could describe which of the following peptides? Check all that apply. pH 10 8.5 3.5 1 2 3 Eq [OH-] O a. ML O b. LYV Oc. Y O d. GY O e. K
Neutral Amino Acids
Amino acids which do not have any charge on them are neutral amino acids.
Globular Protein
The globular proteins refer to the shape of protein specifically spherical in nature apart from spherical form fibrous, disordered and membrane-bound proteins exist. These globular proteins are miscible in water and form a colloidal solution rather than other types which might not exhibit solubility. Many classes of the fold are found in globular proteins, which render them a sphere shape. Globular fold containing proteins usually are referred to by the term globin.
Dimer
Dimers are basic organic compounds, which are derivates of oligomers. It is formed by the combination of two monomers which could potentially be strong or weak and in most cases covalent or intermolecular in nature. Identical monomers are called homodimer, the non-identical dimers are called heterodimer. The method by which dimers are formed is known as “dimerization”.
Dipeptide
A dipeptide is considered a mixture of two distinct amino acids. Since the amino acids are distinct, based on their composition, two dipeptide's isomers can be produced. Various dipeptides are biologically essential and are therefore crucial to industry.
![The following titration curve could describe which of the following peptides? Check all that apply.
pH
10
8.5
3.5
1
2
3
Eq [OH-]
a. ML
| b. LYV
c. Y
O d. GY
O e. K](/v2/_next/image?url=https%3A%2F%2Fcontent.bartleby.com%2Fqna-images%2Fquestion%2F89f34434-f90c-4aa7-8531-0572b7e534b2%2Fff2e1b0a-98dc-4b4b-bf63-1860ba31a85a%2Fs5cyv3_processed.jpeg&w=3840&q=75)

Trending now
This is a popular solution!
Step by step
Solved in 2 steps with 1 images


