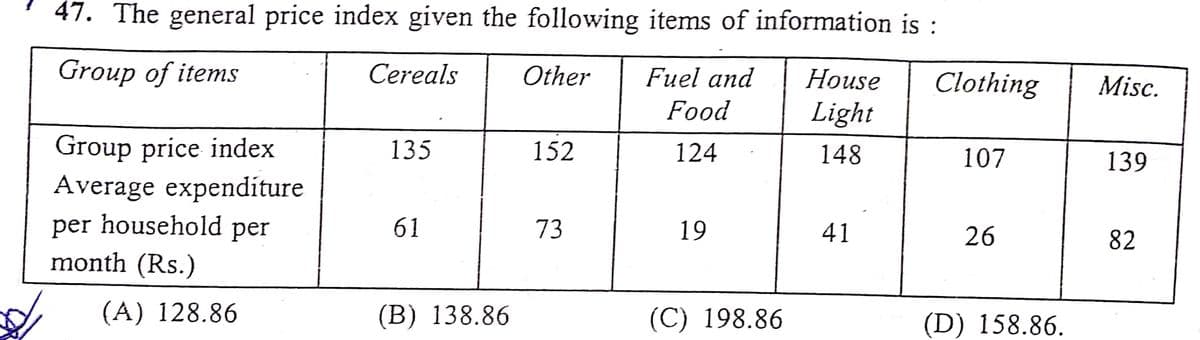
The general price index given the following items of information is : Group of items Cereals Other Fuel and House Clothing Misc. Food Light Group price index Average expenditure per household per month (Rs.) 135 152 124 148 107 139 61 73 19 41 26 82 (A) 128.86 (B) 138.86 (С) 198.86 (D) 158 86
Q: Cloud seeding has been studied for many decades as a weather modification procedure. The rainfall in...
A: Here, we have to test the claim that mean rainfall from seeded clouds exceeds 25 acre-feet. i.e. her...
Q: a) What type of random experiment it is i.e. is it a binomial or hypergeometric? Give reasons to su...
A: A batch of 15 rocker cover gaskets contains 6 defective gaskets. If we draw samples of size 4 withou...
Q: Structural Engineers in an iron manufacturing company describe the results of deformation on the nat...
A: Given: x 230.66 233.05 232.58 229.48 232.58
Q: The following table gives the yields on 15 sample plots under three varieties of seeds : A В 20 18 2...
A:
Q: Solve for the following: A. What is the joint marginal PDF of X and Z? B. Refer to pic
A: Given the joint pdf of X,Y and Z:- f(x,y,z) = xyz29, x∈(0,10) , y∈(0,20) , z∈(0,3) We need to ...
Q: Assume that, using 65 observations of the time series x you estimate the AR(2) model, x =0.2+0.32.x ...
A: There are 65 observations for the model xt=0.2+0.32xt-1+0.41xt-2+ut Breusch Godfrey test for autocor...
Q: Neurological research has shown that in about 80% of people, language abilities reside in the brain’...
A: Given information:- Neurological research has shown that in about 80% of people, language abilities ...
Q: Length of Growing Seasons The growing seasons for a random sample of 31 U.S. cities were recorded, y...
A:
Q: Does the relationship between the independent variable and the dependent variable changeas a functio...
A: Statistical relationship between two variables is referred to as the correlation.
Q: 国 The annual per capita consumption of bottled water was 30.5 gallons. Assume that the per capita co...
A: Given Data : Population Mean,μ = 30.5 Population Standard Deviation,σ = 13
Q: In a study where it focused about the relationship of residential address and compliance rate of stu...
A: Given that In a study where it focused about the relationship of residential address and compliance ...
Q: An article in Cancer Research tested the tumorigenesis of a drug. Rats were randomly selected from l...
A:
Q: a) What is the value of test statistic of this test? (Keep 4 or more decimal places) b) What is t...
A: Given: Sample size, n=36 SAT score, X 550 505 522 519 572 435 506 522 668 516...
Q: 6. For each situation, name the type of bias that may occur in the data collected. Explain your answ...
A: In any data collection method, there are some sources of bias. (a) A survey will not produce accurat...
Q: $2. In 2004 for working class people wheat was selling at an average price of Rs. 16 per 20 kg, clot...
A:
Q: Suppose that the probability density function of a discrete random varial X is given by x = 1, 2, 3,...
A:
Q: For the Value at Risk model, which is false? A. It has been criticized for ignoring the existence o...
A: In this question multiple option is available We need to find which statement is false
Q: Calculate the coefficient of skewness from the following data : Mid-point : Frequency : 15 12 20 18 ...
A:
Q: Agree or Disagree with the following statements and justify your answers. a) A larger sample size le...
A: We have given that two statement about to length of confidence interval. Here we need to check the e...
Q: Puzzled! Complete the Cross Quantile Puzzle by finding the specified measures of position. Use linea...
A: Disclaimer : “Since you have posted a question with multiple sub-parts, we will solve first three su...
Q: 2. The nutritionist also wants to detemine if there is a difference in the average weight loss betwe...
A: T test is used to measure the mean significance between the sample and population. If the assumption...
Q: 54. A manufacturer finds the average demand per day for the machines to repair his new product is 1....
A:
Q: What is the probability that a random applicant gets automatically rejected? If six applicants submi...
A: In Company X, the personnel department gives two aptitude tests to applicants. One measures verbal a...
Q: Given a standardized normal distribution (with a mean of 0 and a standard deviation of 1), complete ...
A: Let Z be the random variable from standard normal distribution with mean = 0 and standard deviation ...
Q: In a case-control study researchers investigated whether there was an association between living nea...
A: Statistical Inference: Statistical inference is the process of drawing inferences about a population...
Q: Is this unusual?.
A: From checking Facebook while walking to class to posting photos on Instagram while eating in the Rus...
Q: A random sample of 12 shearing pins is taken in a study of the Rockwell hardness of the head on the ...
A: Sample size (n) = 12 Sample mean (x̅) = 48.5 Standard deviations (s) = 1.5 Significance level (α) = ...
Q: The following are the prices of commodities in 2016 and 2017. Calculate a price index based on price...
A:
Q: The following are the prices of commodities in 2016 and 2017. Calculate a price index based on price...
A: Index number is used to measure the change in price over a period of time. It is broadly classified ...
Q: Suppose 600 students were surveyed regarding their GPAs. The average GPA was found to be 2.75. Using...
A:
Q: The mean age when smokers first start is 13 years old with a population standard deviation of 1.9 ye...
A:
Q: According to Dietary Goals for the US (1977), high sodium intake may be related to ulcers, stomach c...
A: We have given that, Mean(x̄) = 238, standard deviation (s) = 8.3, sample size (n) = 9 and confidence...
Q: Testing: Ho:µ 48.2 Your sample consists of 23 values, with a sample mean of 49.6. Suppose the popul...
A: As per our guidelines we are supposed to answer only 3 sub-parts of any question so I am solving fir...
Q: Question 8 Within-groups designs reduce error due to differences between the groups by using the sam...
A: Within-groups designs reduce error due to differences between the groups by using the same participa...
Q: Please help with me stats, I am doing section 6.3 (please help with TI-84 commands) thanks :) Part ...
A:
Q: The following table gives the cost of living index numbers for different commodity groups together w...
A:
Q: A local manufacturer will qualify a new machine if the percentage of its serviced product does not e...
A: We have given that Sample size n =250 Favorable cases x =6 Sample proportion p^=x/n =6/250 =0.024 ...
Q: provided. 1. Find an interval of values for Z using the standard normal distribution, corresponding ...
A: We have given that the corresponding area between to z-scores in each case. We have taken the z-scor...
Q: The nutritionist wants to study whether the mean change in triglyceride level of the clients differs...
A: a. Null Hypothesis: H0: The variance is Homogeneous. Alternative Hypothesis: H1: The variance is not...
Q: The brain volumes (cm) of 20 brains have a mean of 10616 cm and a standard deviation of 121.7 cm Use...
A: It is given that Mean = 1061.6 SD = 121.7
Q: Interpret these 4 graphs and Offer explanation(s)/process for each of these patterns.
A: The four scatter plots are given. We have to give interpretation of the graphs.
Q: If a die is thrown 120 times, about how many times should it show a 2?
A: Here Each trials are independent Finite number of trial Probability of success remains constant in...
Q: 11 % of the 100 students in Emmie Xi Hem International School students said that they had been late ...
A:
Q: In estimating the actual percentage of medications that are of excellent quality using a 90% confide...
A:
Q: Complete each table.
A: The objective is to fill in the missing entries in the table. Since there are multiple subparts we w...
Q: 2, 10, 13, 14, 18, 23, 26, 27, 33, 39, 44, 45, 47, 53, 60, 61, 71, 72, 78, 86, 103, 103, 106, 114, 1...
A:
Q: A particular brand of trans-fat butter was analyzed to determine the level of polyunsaturated fatty ...
A: Given data set: Xi: 16.8, 17.2, 17.4, 16.9, 16.5, 17.1 Mean= ΣXi/n =(16.8+17.2+17.4+16.9+16.5+17.1...
Q: In September 2007, U.S home prices fell at a record pace, and price declines in Los Angeles and Oran...
A: From the provided information, Sample size (n) = 34 Sample mean (x̄) = 9.6% Sample standard deviatio...
Q: Engineers designing the next generation of space shuttles plan to include two fuel pumps- one active...
A:
Step by step
Solved in 2 steps with 2 images
- Mr. William Profit is studying companies going public for the first time. He is particularly interested in the relationship between the size of the offering and the price per share. A sample of 15 companies that recently went public revealed the following information. Size Price Size Price ($ millions), per Share, ($ millions), per Share, Company x y Company x y 1 9.0 10.8 9 160.7 11.3 2 94.4 11.3 10 96.5 10.6 3 27.3 11.2 11 83.0 10.5 4 179.2 11.1 12 23.5 10.3 5 71.9 11.1 13 58.7 10.7 6 97.9 11.2 14 93.8 11.0 7 93.5 11.0 15 34.4 10.8 8 70.0 10.7 Click here for the Excel Data File a. Determine the regression equation. (Round your answers to 4 decimal places.) b-1. State the decision rule for 0.05 significance level: H0: β ≤ 0; H1: β > 0. (Round your answer to 3 decimal places.) b-2. Compute the value of the test statistic. (Round your…The following table gives the prices of some food items in the base year and current year and the quantities sold in the base year and current year. Commodity 2000 2005 Price (K) Quantity Price (K) Quantity A B C 15 20 4 15 5 10 22 27 7 12 4 5 Compute the following price index numbers for 2005 from the above table: i. Laspeyre’s price index number ii. Paasche’s price index numberThe demand for hand sanitizers is off the charts due to this coronavirus outbreak. People are in desperate need of hand sanitizers. Therefore, FMCGs like Unilever Bangladesh Limited are producing this life-essential product in a bulk amount to help the citizens across Bangladesh to maintain the hygiene standards. Sales figures and profits for the stores are given in the following table. (For the Unit sales, pick any value in between 12-33Units in ascending order). Unit Sales, X Profit (Taka), Y ** 1200 ** 1650 ** 1950 ** 2300 ** 2700 ** 3600 ** 4100 Obtain a regression line for the data. Calculate the profit of a shop for 40 unit sales. Calculate the correlation between unit sales and profit. What is the coefficient of determination of these variables?
- The prices and the numbers of various items produced by a small machine and stamping plant are reported below. Use 2010 as the base. 2010 2018 Item Price Quantity Price Quantity Washer $ 0.07 17,000 $ 0.10 20,000 Cotter pin 0.04 125,000 0.03 130,000 Stove bolt 0.15 40,000 0.15 42,000 Hex nut 0.08 62,000 0.10 65,000 a. Determine the simple price indexes. (Round your answers to 2 decimal places.) b. Determine the simple aggregate price index for the two years. (Round your answer to 2 decimal places.) c. Determine the Laspeyres price index. (Round your answer to 2 decimal places.) d. Determine the Paasche price index. (Round your answer to 2 decimal places.) e. Determine Fisher's ideal index. (Round your answer to 2 decimal places.)The prices and the numbers of various items produced by a small machine and stamping plant are reported below. Use 2010 as the base. 2010 2018 Item Price (in $) Quantity Price (in $) Quantity Washer 0.07 17,000 0.10 20,000 Cotter pin 0.04 125,000 0.03 130,000 Stove bolt 0.15 40,000 0.15 42,000 Hex nut 0.08 62,000 0.10 65,000 a. Determine the Laspeyres price index. (Round your answer to 2 decimal places.) b. Determine the Paasche price index. (Round your answer to 2 decimal places.)The following table gives the prices of some food items in the base year and current year and the quantities sold in the base year and current year. Commodity 2000 2005 Price (K) Quantity Price (K) Quantity A 15 15 22 12 B 20 5 27 4 C 4 10 7 5 Compute the following price index numbers for 2005 from the above table: Laspeyre’s price index number Paasche’s price index number
- In a particularly small region in the Philippines, the consumer price index C depends on(Feb 21—27) Projected Actual Difference Food Cost $6,971 $7,842 +$871 (over) Beverage Cost $3,954 $4, 156 +$202 (over) Labor Cost $8,423 $9,541 +$1,118 (over) Other Costs $7,645 $7,645 $0 (even) Total Costs $26,993 $29, 184 +$2191 (over) Food Sales $18,565 $14,326 -$4,239 (under) Beverage Sales $12,872 $10,852 -$2,020 (under) Total Sales (Revenue) $31,437 $25,178 -$6,259 (under) Total Profit $4,444 -$4,006 -$8,450 (under) Based on the actual results, what adjustments need to be made to Food and Beverage sales projections for next week? a. Projections for next week should be set the same as this week, so we can strive to reach our goals. b. Projections for next week should be increased because we exceeded our projections this week c. Because this week's actual profit (-$4006) came in below our projected profit ($4444), we should reduce next week's Food and Beverage sales…Mr. William Profit is studying companies going public for the first time. He is particularlyinterested in the relationship between the size of the offering and the price per share.A sample of 15 companies that recently went public revealed the following information.
- 1. What does calculating the Bendford's average tell us about Individuals? 2. What can we learn by looking at an individual's transactions using the lens of Bendford's law?The data in the table characterizes the income distribution for a country. Income category Share of income (%) Cumulative share of income (%) first quintile 7.0 --- second quintile 9.0 16.0 third quintile --- 37.0 fourth quintile 25.0 --- fifth quintile 38.038.0 --- What percentage of the total population is categorized as belonging to the second quintile? Give your responses as whole numbers. Percentage of population in second quintile:__________% What percentage of the total income for the country is earned by the third quintile? Percentage earned by the third quintile:__________% What is the cumulative share of income earned by the poorest 80% of the population? Percentage earned by the poorest 80%:__________%Price information for selected foods for 2010 and 2018 is given in the table. Price Quantity Item 2010 2018 2010 2018 Cabbage (pound) $ 0.06 $ 0.05 2,000 1,500 Carrots (bunch) 0.10 0.12 200 200 Peas (quart) 0.20 0.18 400 500 Endive (bunch) 0.15 0.15 100 200 Compute a simple price index for each of the four items. Use 2010 as the base period. (Round your answers to 2 decimal places.)