Concerned about the initial monitoring data, the environmental action group decides to continue to monitor the plant, and try to gather more evidence for their case. A random sample of twenty-six hours is selected over a period of a week. The observations (gallons of wastewater discharged per hour) are 1036 1047 996 1052 1136 1131 958 1058 1087 1146 1111 1040 884 997 1130 994 963 1127 1136 1126 The output of a statistical analysis software on this dataset is shown below N Mean Std. Dev. 26 1081 89.6 Reading the output, we find that • The sample size is n = • The sample mean is a • The sample standard deviation is s = • From this we can calculate the standard error to be SE Note that the observed sample mean is is greater than 1000 gallons per hour. This could mean that the plant is discharging more wastewater than they promised, or the plant could be in compliance, and the large numbers were due to sampling variability. To see if this is the case, we will test the hypothesis that u alternative that u + 1000 at a significance level of 1000 against the :0.05. * – 1000 • Calculate the t-score t SE • The degrees of freedom for the t-score is n – 1 =
Concerned about the initial monitoring data, the environmental action group decides to continue to monitor the plant, and try to gather more evidence for their case. A random sample of twenty-six hours is selected over a period of a week. The observations (gallons of wastewater discharged per hour) are 1036 1047 996 1052 1136 1131 958 1058 1087 1146 1111 1040 884 997 1130 994 963 1127 1136 1126 The output of a statistical analysis software on this dataset is shown below N Mean Std. Dev. 26 1081 89.6 Reading the output, we find that • The sample size is n = • The sample mean is a • The sample standard deviation is s = • From this we can calculate the standard error to be SE Note that the observed sample mean is is greater than 1000 gallons per hour. This could mean that the plant is discharging more wastewater than they promised, or the plant could be in compliance, and the large numbers were due to sampling variability. To see if this is the case, we will test the hypothesis that u alternative that u + 1000 at a significance level of 1000 against the :0.05. * – 1000 • Calculate the t-score t SE • The degrees of freedom for the t-score is n – 1 =

MATLAB: An Introduction with Applications
6th Edition
ISBN:9781119256830
Author:Amos Gilat
Publisher:Amos Gilat
Chapter1: Starting With Matlab
Section: Chapter Questions
Problem 1P

Related questions
Question
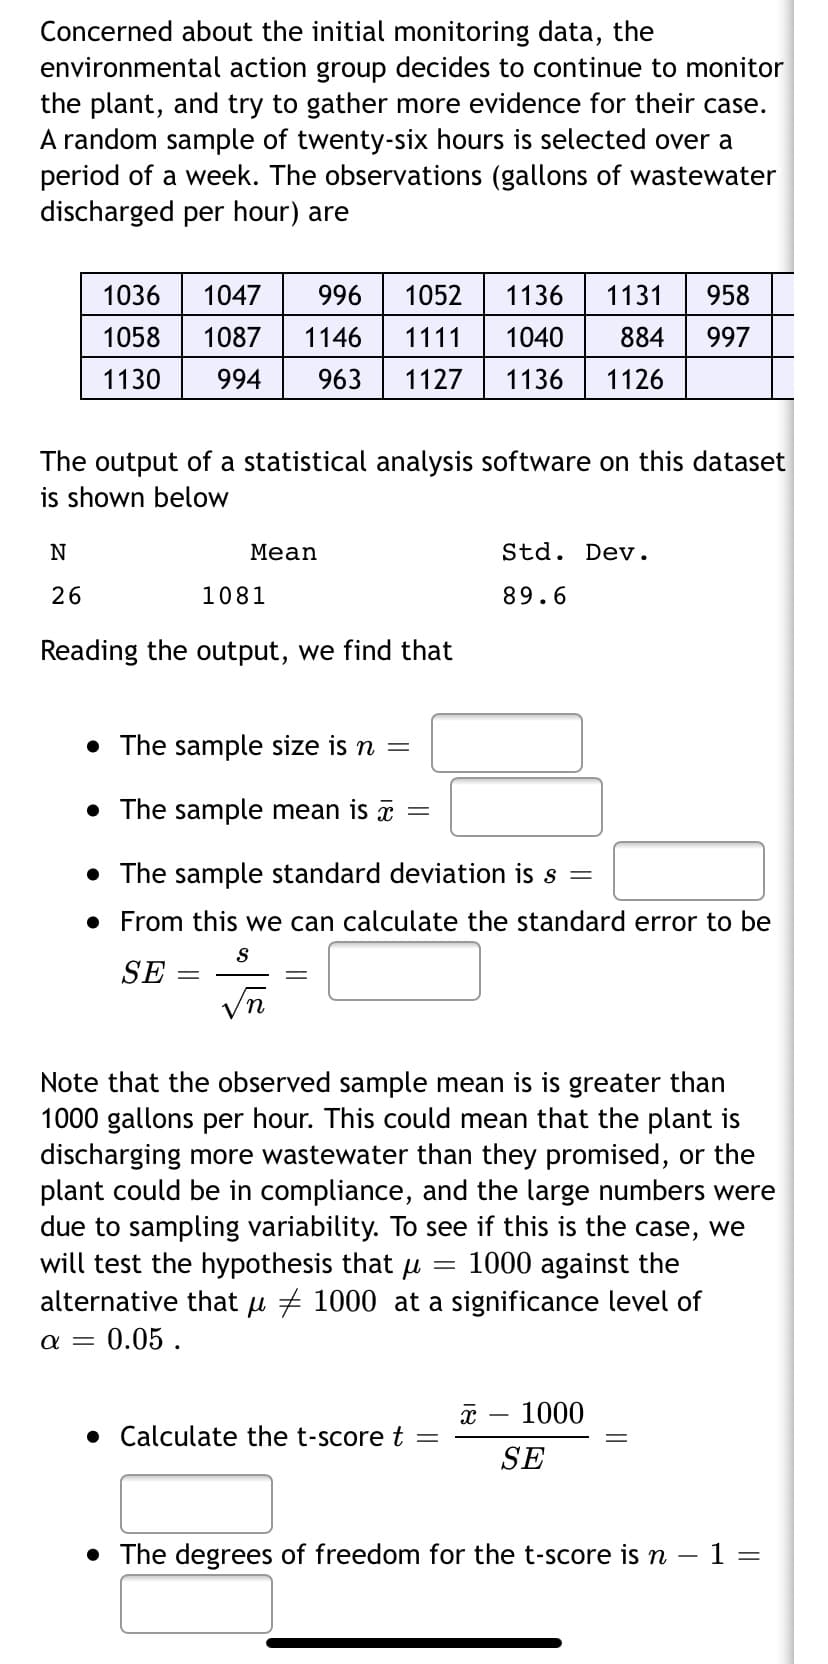
Transcribed Image Text:Concerned about the initial monitoring data, the
environmental action group decides to continue to monitor
the plant, and try to gather more evidence for their case.
A random sample of twenty-six hours is selected over a
period of a week. The observations (gallons of wastewater
discharged per hour) are
1036
1047
996
1052
1136
1131
958
1058
1087
1146
1111
1040
884
997
1130
994
963
1127
1136
1126
The output of a statistical analysis software on this dataset
is shown below
N
Mean
Std. Dev.
26
1081
89.6
Reading the output, we find that
• The sample size is n =
• The sample mean is a
• The sample standard deviation is s =
• From this we can calculate the standard error to be
SE
Note that the observed sample mean is is greater than
1000 gallons per hour. This could mean that the plant is
discharging more wastewater than they promised, or the
plant could be in compliance, and the large numbers were
due to sampling variability. To see if this is the case, we
will test the hypothesis that u
alternative that u + 1000 at a significance level of
1000 against the
:0.05.
* – 1000
• Calculate the t-score t
SE
• The degrees of freedom for the t-score is n – 1 =
Expert Solution
This question has been solved!
Explore an expertly crafted, step-by-step solution for a thorough understanding of key concepts.

Step by step
Solved in 2 steps with 1 images

Knowledge Booster


Learn more about
Need a deep-dive on the concept behind this application? Look no further. Learn more about this topic, statistics and related others by exploring similar questions and additional content below.Recommended textbooks for you
MATLAB: An Introduction with Applications
Statistics
ISBN:
9781119256830
Author:
Amos Gilat
Publisher:
John Wiley & Sons Inc

Probability and Statistics for Engineering and th…
Statistics
ISBN:
9781305251809
Author:
Jay L. Devore
Publisher:
Cengage Learning

Statistics for The Behavioral Sciences (MindTap C…
Statistics
ISBN:
9781305504912
Author:
Frederick J Gravetter, Larry B. Wallnau
Publisher:
Cengage Learning
MATLAB: An Introduction with Applications
Statistics
ISBN:
9781119256830
Author:
Amos Gilat
Publisher:
John Wiley & Sons Inc
Probability and Statistics for Engineering and th…
Statistics
ISBN:
9781305251809
Author:
Jay L. Devore
Publisher:
Cengage Learning
Statistics for The Behavioral Sciences (MindTap C…
Statistics
ISBN:
9781305504912
Author:
Frederick J Gravetter, Larry B. Wallnau
Publisher:
Cengage Learning

Elementary Statistics: Picturing the World (7th E…
Statistics
ISBN:
9780134683416
Author:
Ron Larson, Betsy Farber
Publisher:
PEARSON

The Basic Practice of Statistics
Statistics
ISBN:
9781319042578
Author:
David S. Moore, William I. Notz, Michael A. Fligner
Publisher:
W. H. Freeman

Introduction to the Practice of Statistics
Statistics
ISBN:
9781319013387
Author:
David S. Moore, George P. McCabe, Bruce A. Craig
Publisher:
W. H. Freeman