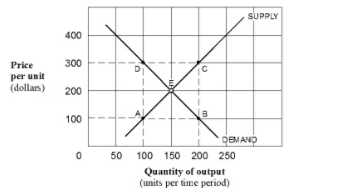
The graph attached shows the demand and supply in a market. (a) The equilibrium quantity is -------------- and the equilibrium price is -----------. (b) If the actual market price is set at $100 per unit, there will be a --------------- (shortage or surplus) of ____units in this market. (c) If government wants to use a price floor, it should choose a price of how much?
The graph attached shows the demand and supply in a market. (a) The equilibrium quantity is -------------- and the equilibrium price is -----------. (b) If the actual market price is set at $100 per unit, there will be a --------------- (shortage or surplus) of ____units in this market. (c) If government wants to use a price floor, it should choose a price of how much?

Chapter4: Economic Evaluation In Health Care
Section: Chapter Questions
Problem 7QAP

Related questions
Question
The graph attached shows the
(a) The
(b) If the actual market price is set at $100 per unit, there will be a --------------- (shortage or surplus) of ____units in this market.
(c) If government wants to use a
(d) At that price floor how many units are going to be sold in this market?
Transcribed Image Text:SUPPLY
400
Price
300
per unit
(dollars)
200
100
DEMAND
50
100 150 200 250
Quantity of output
(units per time period)
Expert Solution
This question has been solved!
Explore an expertly crafted, step-by-step solution for a thorough understanding of key concepts.

Step by step
Solved in 4 steps with 3 images

Knowledge Booster


Learn more about
Need a deep-dive on the concept behind this application? Look no further. Learn more about this topic, economics and related others by exploring similar questions and additional content below.Recommended textbooks for you