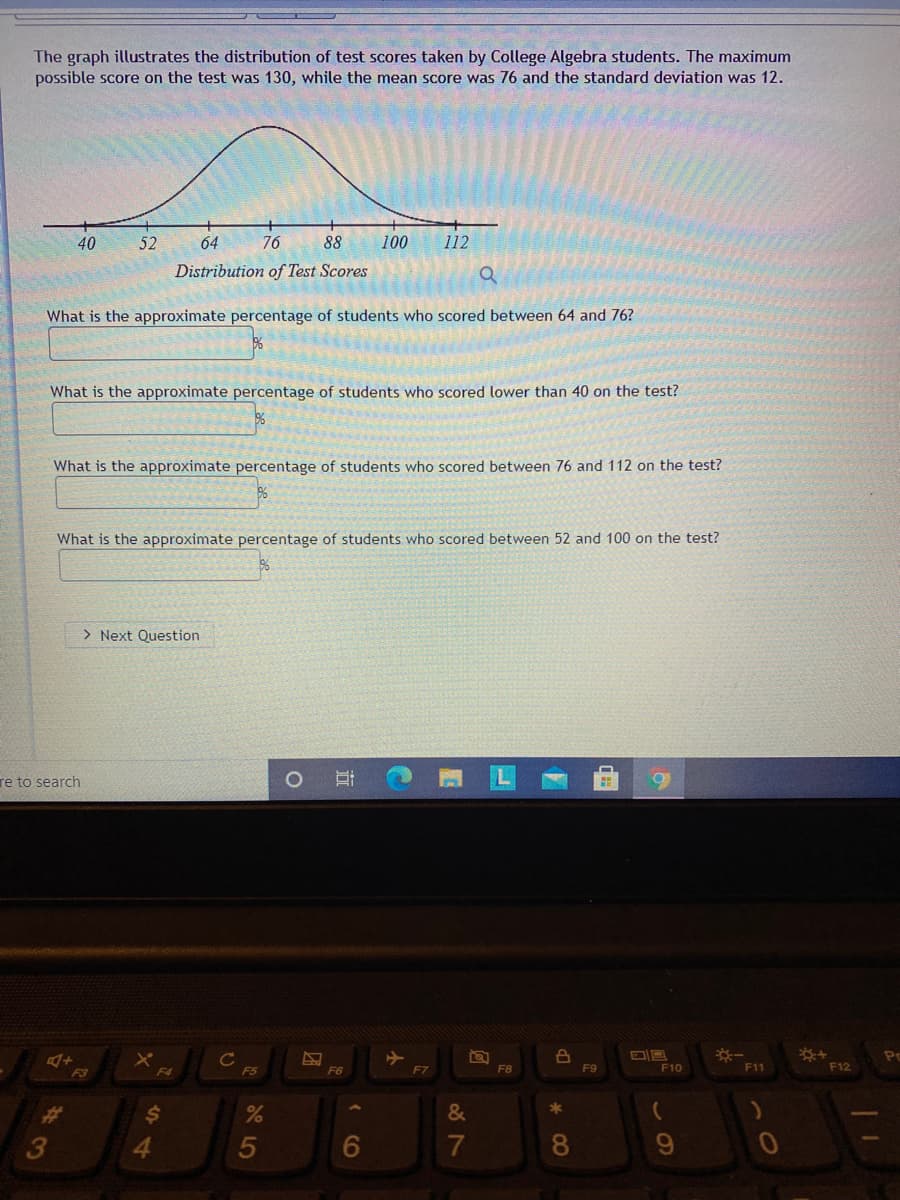
The graph illustrates the distribution of test scores taken by College Algebra students. The maximum possible score on the test was 130, while the mean score was 76 and the standard deviation was 12.
The graph illustrates the distribution of test scores taken by College Algebra students. The maximum possible score on the test was 130, while the mean score was 76 and the standard deviation was 12.

MATLAB: An Introduction with Applications
6th Edition
ISBN:9781119256830
Author:Amos Gilat
Publisher:Amos Gilat
Chapter1: Starting With Matlab
Section: Chapter Questions
Problem 1P

Related questions

Question
Transcribed Image Text:The graph illustrates the distribution of test scores taken by College Algebra students. The maximum
possible score on the test was 130, while the mean score was 76 and the standard deviation was 12.
40
52
64
76
88
100
112
Distribution of Test Scores
What is the approximate percentage of students who scored between 64 and 76?
What is the approximate percentage of students who scored lower than 40 on the test?
What is the approximate percentage of students who scored between 76 and 112 on the test?
What is the approximate percentage of students who scored between 52 and 100 on the test?
> Next Question
re to search
Pr
F3
F4
F5
F6
F7
F8
F9
F10
F11
F12
2$
&
3
5
6
8.
Expert Solution
Step 1
Hello. Since your question has multiple sub-parts, we will solve first three sub-parts for you. If you want remaining sub-parts to be solved, then please resubmit the whole question and specify those sub-parts you want us to solve.
Given:
Mean, =76
Standard deviation, =12
(a) Percentage of student who scored between 64 and 76:
Hence, percentage of student who scored between 64 and 76 is 34.13%.

Step by step
Solved in 2 steps

Knowledge Booster


Learn more about
Need a deep-dive on the concept behind this application? Look no further. Learn more about this topic, statistics and related others by exploring similar questions and additional content below.Recommended textbooks for you
MATLAB: An Introduction with Applications
Statistics
ISBN:
9781119256830
Author:
Amos Gilat
Publisher:
John Wiley & Sons Inc

Probability and Statistics for Engineering and th…
Statistics
ISBN:
9781305251809
Author:
Jay L. Devore
Publisher:
Cengage Learning

Statistics for The Behavioral Sciences (MindTap C…
Statistics
ISBN:
9781305504912
Author:
Frederick J Gravetter, Larry B. Wallnau
Publisher:
Cengage Learning
MATLAB: An Introduction with Applications
Statistics
ISBN:
9781119256830
Author:
Amos Gilat
Publisher:
John Wiley & Sons Inc
Probability and Statistics for Engineering and th…
Statistics
ISBN:
9781305251809
Author:
Jay L. Devore
Publisher:
Cengage Learning
Statistics for The Behavioral Sciences (MindTap C…
Statistics
ISBN:
9781305504912
Author:
Frederick J Gravetter, Larry B. Wallnau
Publisher:
Cengage Learning

Elementary Statistics: Picturing the World (7th E…
Statistics
ISBN:
9780134683416
Author:
Ron Larson, Betsy Farber
Publisher:
PEARSON

The Basic Practice of Statistics
Statistics
ISBN:
9781319042578
Author:
David S. Moore, William I. Notz, Michael A. Fligner
Publisher:
W. H. Freeman

Introduction to the Practice of Statistics
Statistics
ISBN:
9781319013387
Author:
David S. Moore, George P. McCabe, Bruce A. Craig
Publisher:
W. H. Freeman