The graph of the accompanying figure shows the average annual percentage change y = f(t) in a particular country's gross national product (GNP) for the years 1979-1984. dy Choose the correct graph of OA. OB. Ay (%) 10 Ay' 10- Ay' 10- 8 1979 1979 -10- -10- 4- OC. OD. Ay" 10- 2- 10 1979 1980 1981 1982 1983 1984 Year 1979 1979 -10- -10
The graph of the accompanying figure shows the average annual percentage change y = f(t) in a particular country's gross national product (GNP) for the years 1979-1984. dy Choose the correct graph of OA. OB. Ay (%) 10 Ay' 10- Ay' 10- 8 1979 1979 -10- -10- 4- OC. OD. Ay" 10- 2- 10 1979 1980 1981 1982 1983 1984 Year 1979 1979 -10- -10

Chapter6: Exponential And Logarithmic Functions
Section6.8: Fitting Exponential Models To Data
Problem 3TI: Table 6 shows the population, in thousands, of harbor seals in the Wadden Sea over the years 1997 to...

Related questions
Question
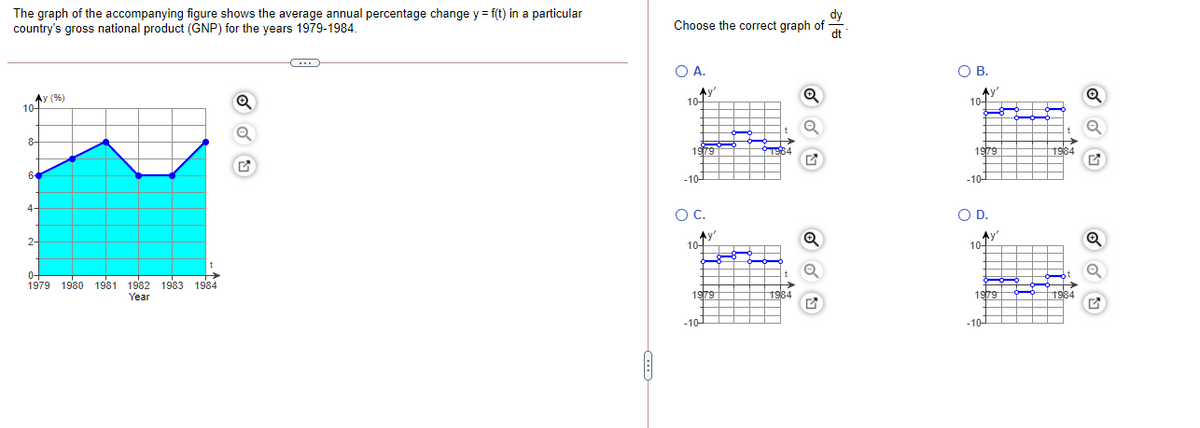
Transcribed Image Text:The graph of the accompanying figure shows the average annual percentage change y = f(t) in a particular
country's gross national product (GNP) for the years 1979-1984.
dy
Choose the correct graph of
dt
O A.
OB.
Ay (%)
10
Ay'
10-
Ay
10
8-
1979
1979
-10-
-10-
4-
OC.
OD.
Ay'
10
Ay
10-
2-
0-
1979 1980 1981 1982 1983 1984
Year
1979
-10-
-10-
Expert Solution
This question has been solved!
Explore an expertly crafted, step-by-step solution for a thorough understanding of key concepts.

Step by step
Solved in 2 steps with 2 images

Recommended textbooks for you