The graph on the right shows the demand and supply curves in the market tor workers in Starbucks coffee shops (called "baristas"). Assume that Starbucks baristas are unwilling to accept a wage lower than $11 per hour, causing the wage to be fixed at that level. Suppose that, due to concerns about the high number of calories in many Starbucks drinks, the demand for Starbucks products declines. 16 14- Use a graph to explain what will happen to employment in the market for baristas? 12- 1.) Usirg the line drawing tool, plol either a new labor supply or labor dermand curve that would resul from the decline in Slarbucks sales. Label your line approprialely. 2.) Using the point drawing tool, plot a point that illustrates the new quantily of labor supplied when the wage rate is fixed at $11 per hour. Label your point 'A. 6- 3.) Using the point drewing tool, plot a point that illustrates the new quantity of labor demanded when the wage rate is fixed at $11 per hour. Lebel your point 'B.' Do Carefully follow the instructions above and only draw the required objects. * to 12 14 16 18 20 Given your graph, the lolal amount of unemployment that would result from the decline in dermand for Slarbucks products along with having a fixed wage at S11 can be found by Quantity of labor O A. adding the quantity of labor at point A to the quantity of labor at point B and dividing by 2 OB. adding the quantity of labor at point A to the quantity of labor at point B. OC. subtracting the quantity of labor at point B from the quantity of labor at point A and dividing by 2. OD. subtracting the quantity of labor at point B from the quantity of labor at point A.
The graph on the right shows the demand and supply curves in the market tor workers in Starbucks coffee shops (called "baristas"). Assume that Starbucks baristas are unwilling to accept a wage lower than $11 per hour, causing the wage to be fixed at that level. Suppose that, due to concerns about the high number of calories in many Starbucks drinks, the demand for Starbucks products declines. 16 14- Use a graph to explain what will happen to employment in the market for baristas? 12- 1.) Usirg the line drawing tool, plol either a new labor supply or labor dermand curve that would resul from the decline in Slarbucks sales. Label your line approprialely. 2.) Using the point drawing tool, plot a point that illustrates the new quantily of labor supplied when the wage rate is fixed at $11 per hour. Label your point 'A. 6- 3.) Using the point drewing tool, plot a point that illustrates the new quantity of labor demanded when the wage rate is fixed at $11 per hour. Lebel your point 'B.' Do Carefully follow the instructions above and only draw the required objects. * to 12 14 16 18 20 Given your graph, the lolal amount of unemployment that would result from the decline in dermand for Slarbucks products along with having a fixed wage at S11 can be found by Quantity of labor O A. adding the quantity of labor at point A to the quantity of labor at point B and dividing by 2 OB. adding the quantity of labor at point A to the quantity of labor at point B. OC. subtracting the quantity of labor at point B from the quantity of labor at point A and dividing by 2. OD. subtracting the quantity of labor at point B from the quantity of labor at point A.

Chapter11: Resource Market
Section: Chapter Questions
Problem 5.8P

Related questions
Question
Transcribed Image Text:Economics
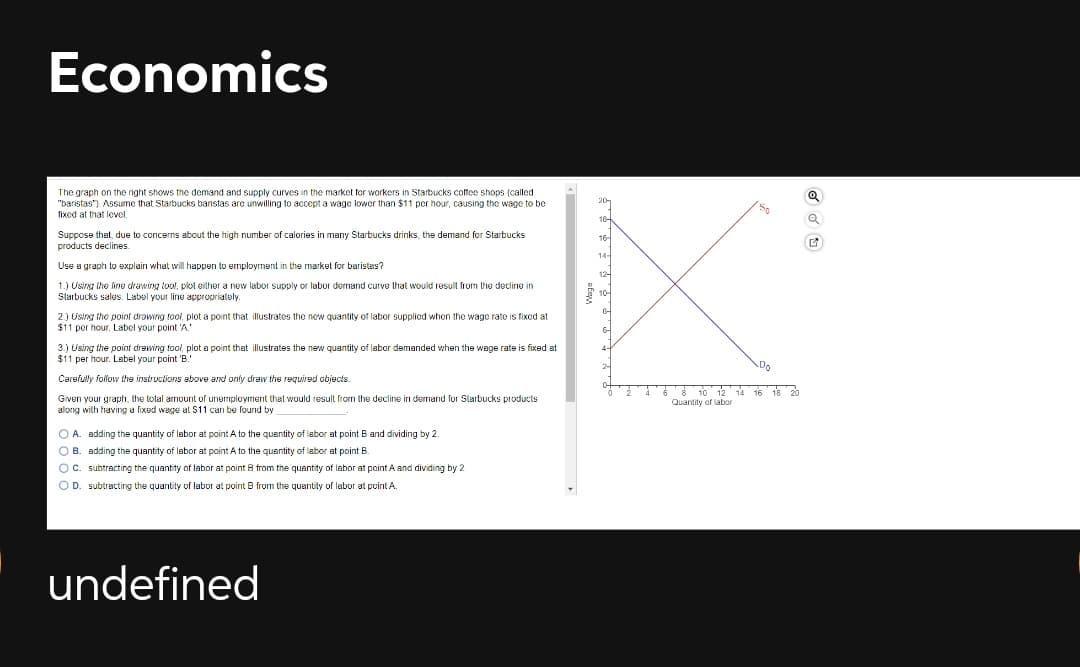
The graph on the right shows the demand and supply curves in the market for workers in Starbucks coffee shops (called
"baristas"). Assume that Starbucks barnistas are unwilling to accept a wage lower than $11 per hour, causing the wage to be
fixed at that level.
18-
Suppose that, due to concerns about the high number of calories in many Starbucks drinks, the demand for Starbucks
products declines.
16-
14-
Use a graph to explain what will happen to employrment in the market for baristas?
12-
1.) Using the line drawing tool, plot either a new labor supply or labor demand curve that would result from the decline in
Slarbucks sales. Label your line approprialely.
2.) Using the point drawing tool, plot a point that illustrates the new quantity of labor supplied when the wage rate is fixed at
$11 per hour. Label your point 'A."
6-
3.) Using the point drewing tool, plot a point that illustrates the new quantity of labor demanded when the wage rate is fixed at
$11 per hour. Label your point 'B.'
2-
Carsfully follow the instructions above and only draw the required objects.
12 14 16 18 20
Given your graph, the lolal armount of unemployment that would result fron the decline in demand for Slarbucks products
along with having a fixed wage at $11 can be fournd by
Quantity of labor
O A. adding the quantity of labor at point A to the quantity of labor at point B and dividing by 2.
O B. adding the quantity of labor at point A to the quantity of labor at point B.
OC. subtracting the quantity of labor at point B from the quantity of labor at point A and dividing by 2.
OD. subtracting the quantity of lubor at point B from the quantity of labor at point A.
undefined
Expert Solution
This question has been solved!
Explore an expertly crafted, step-by-step solution for a thorough understanding of key concepts.

This is a popular solution!

Trending now
This is a popular solution!

Step by step
Solved in 3 steps with 1 images

Knowledge Booster


Learn more about
Need a deep-dive on the concept behind this application? Look no further. Learn more about this topic, economics and related others by exploring similar questions and additional content below.Recommended textbooks for you

Macroeconomics: Principles and Policy (MindTap Co…
Economics
ISBN:
9781305280601
Author:
William J. Baumol, Alan S. Blinder
Publisher:
Cengage Learning

Macroeconomics: Principles and Policy (MindTap Co…
Economics
ISBN:
9781305280601
Author:
William J. Baumol, Alan S. Blinder
Publisher:
Cengage Learning


Economics (MindTap Course List)
Economics
ISBN:
9781337617383
Author:
Roger A. Arnold
Publisher:
Cengage Learning

Microeconomics: Principles & Policy
Economics
ISBN:
9781337794992
Author:
William J. Baumol, Alan S. Blinder, John L. Solow
Publisher:
Cengage Learning