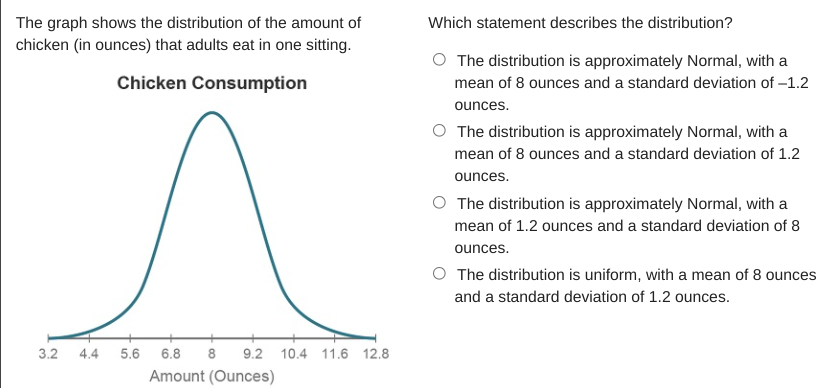
The graph shows the distribution of the amount of chicken (in ounces) that adults eat in one sitting. Which statement describes the distribution? O The distribution is approximately Normal, with a Chicken Consumption mean of 8 ounces and a standard deviation of -1.2 ounces. O The distribution is approximately Normal, with a mean of 8 ounces and a standard deviation of 1.2 ounces. O The distribution is approximately Normal, with a mean of 1.2 ounces and a standard deviation of 8 ounces. O The distribution is uniform, with a mean of 8 ounces and a standard deviation of 1.2 ounces. 3.2 4.4 5.6 6.8 9.2 10.4 11.6 12.8 Amount (Ounces)
The graph shows the distribution of the amount of chicken (in ounces) that adults eat in one sitting. Which statement describes the distribution? O The distribution is approximately Normal, with a Chicken Consumption mean of 8 ounces and a standard deviation of -1.2 ounces. O The distribution is approximately Normal, with a mean of 8 ounces and a standard deviation of 1.2 ounces. O The distribution is approximately Normal, with a mean of 1.2 ounces and a standard deviation of 8 ounces. O The distribution is uniform, with a mean of 8 ounces and a standard deviation of 1.2 ounces. 3.2 4.4 5.6 6.8 9.2 10.4 11.6 12.8 Amount (Ounces)

Glencoe Algebra 1, Student Edition, 9780079039897, 0079039898, 2018
18th Edition
ISBN:9780079039897
Author:Carter
Publisher:Carter
Chapter10: Statistics
Section10.4: Distributions Of Data
Problem 22PFA

Related questions
Question
Transcribed Image Text:The graph shows the distribution of the amount of
chicken (in ounces) that adults eat in one sitting.
Which statement describes the distribution?
O The distribution is approximately Normal, with a
Chicken Consumption
mean of 8 ounces and a standard deviation of -1.2
ounces.
O The distribution is approximately Normal, with a
mean of 8 ounces and a standard deviation of 1.2
ounces.
O The distribution is approximately Normal, with a
mean of 1.2 ounces and a standard deviation of 8
ounces.
O The distribution is uniform, with a mean of 8 ounces
and a standard deviation of 1.2 ounces.
3.2
4.4
5.6
6.8
9.2
10.4 11.6 12.8
Amount (Ounces)
Expert Solution
This question has been solved!
Explore an expertly crafted, step-by-step solution for a thorough understanding of key concepts.

This is a popular solution!

Trending now
This is a popular solution!

Step by step
Solved in 2 steps

Recommended textbooks for you
Glencoe Algebra 1, Student Edition, 9780079039897…
Algebra
ISBN:
9780079039897
Author:
Carter
Publisher:
McGraw Hill
Glencoe Algebra 1, Student Edition, 9780079039897…
Algebra
ISBN:
9780079039897
Author:
Carter
Publisher:
McGraw Hill