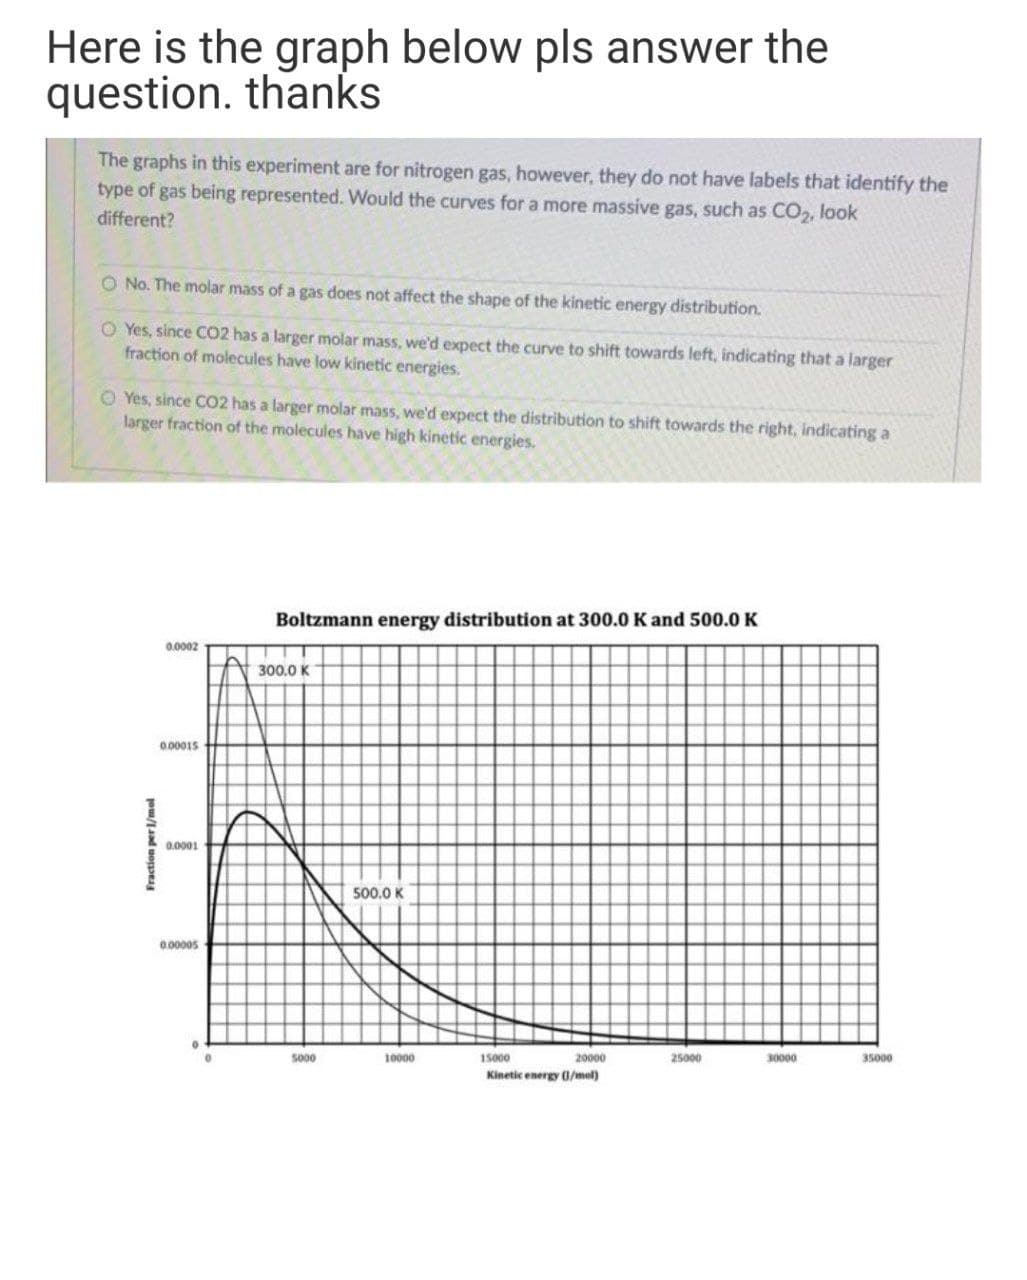
The graphs in this experiment are for nitrogen gas, however, they do not have labels that identify the type of gas being represented. Would the curves for a more massive gas, such as CO2, look different? O No. The molar mass of a gas does not affect the shape of the kinetic energy distribution. O Yes, since CO2 has a larger molar mass, we'd expect the curve to shift towards left, indicating that a larger fraction of molecules have low kinetic energies. O Yes, since CO2 has a larger molar mass, we'd expect the distribution to shift towards the right, indicating a larger fraction of the molecules have high kinetic energies.


Thermochemistry
Thermochemistry can be considered as a branch of thermodynamics that deals with the connections between warmth, work, and various types of energy, formed because of different synthetic and actual cycles. Thermochemistry describes the energy changes that occur as a result of reactions or chemical changes in a substance.
Exergonic Reaction
The term exergonic is derived from the Greek word in which ‘ergon’ means work and exergonic means ‘work outside’. Exergonic reactions releases work energy. Exergonic reactions are different from exothermic reactions, the one that releases only heat energy during the course of the reaction. So, exothermic reaction is one type of exergonic reaction. Exergonic reaction releases work energy in different forms like heat, light or sound. For example, a glow stick releases light making that an exergonic reaction and not an exothermic reaction since no heat is released. Even endothermic reactions at very high temperature are exergonic.


Trending now
This is a popular solution!

Step by step
Solved in 2 steps with 2 images


