The heightS (in inches) for a sample of 20 male adults are 62, 82, 79, 76, 73, 70, 67, 64, 61, 80, 79, 75, 72, 69, 71, 71, 74, 74, 74, 75 Send data to calculator Draw the histogram for these data using an initial class boundary of 60.5 and a class width of 5. Note that you can add or remove classes from the figure. Label each class with its endpoints.
The heightS (in inches) for a sample of 20 male adults are 62, 82, 79, 76, 73, 70, 67, 64, 61, 80, 79, 75, 72, 69, 71, 71, 74, 74, 74, 75 Send data to calculator Draw the histogram for these data using an initial class boundary of 60.5 and a class width of 5. Note that you can add or remove classes from the figure. Label each class with its endpoints.

Glencoe Algebra 1, Student Edition, 9780079039897, 0079039898, 2018
18th Edition
ISBN:9780079039897
Author:Carter
Publisher:Carter
Chapter10: Statistics
Section: Chapter Questions
Problem 25SGR

Related questions
Question
100%
Transcribed Image Text:O DESCRIPTIVE STATISTICS
Shasia v
Histograms for grouped data
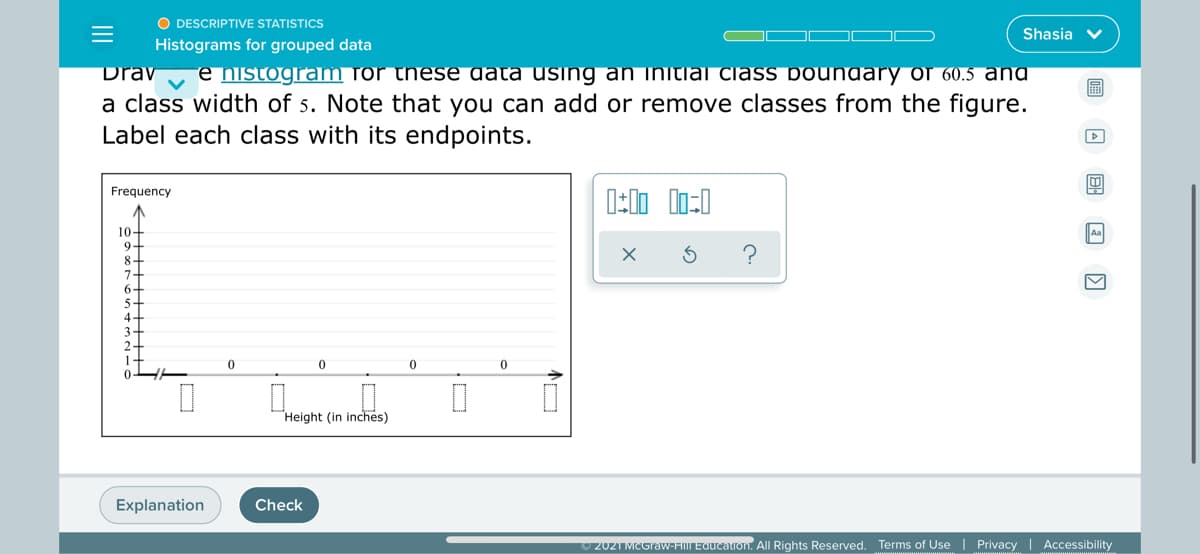
Drav
e histogram for these data using an initiai class boundary of 60.5 ang
a class width of 5. Note that you can add or remove classes from the figure.
Label each class with its endpoints.
Frequency
10+
9-
8-
7-
6-
5-
Aa
4-
Height (in inches)
Explanation
Check
2021 MCGraw-FIM EQucalion. All Rights Reserved. Terms of Use | Privacy | Accessibility
Transcribed Image Text:AA
A www-awn.aleks.com
+
Home | iCampus
Bb Week 8 - MAT300457VA016-121...
A ALEKS - Shasia Gibbs - Learn
O DESCRIPTIVE STATISTICS
Shasia v
Histograms for grouped data
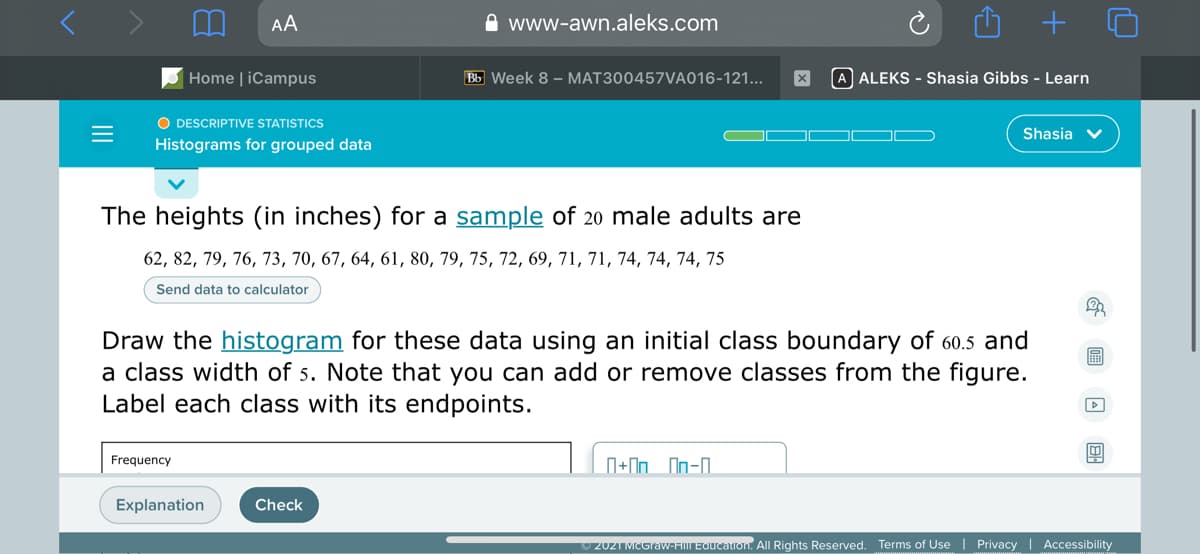
The heights (in inches) for a sample of 20 male adults are
62, 82, 79, 76, 73, 70, 67, 64, 61, 80, 79, 75, 72, 69, 71, 71, 74, 74, 74, 75
Send data to calculator
Draw the histogram for these data using an initial class boundary of 60.5 and
a class width of 5. Note that you can add or remove classes from the figure.
Label each class with its endpoints.
圖
Frequency
N+In On-0.
Explanation
Check
2021 MCGraw-HIL Education. All Rights Reserved. Terms of Use | Privacy | Accessibility
Expert Solution
Step 1
The minimum and maximum scores are 61 and 82, respectively.
There are total 20 observations.

Trending now
This is a popular solution!

Step by step
Solved in 2 steps with 2 images

Knowledge Booster


Learn more about
Need a deep-dive on the concept behind this application? Look no further. Learn more about this topic, statistics and related others by exploring similar questions and additional content below.Recommended textbooks for you
Glencoe Algebra 1, Student Edition, 9780079039897…
Algebra
ISBN:
9780079039897
Author:
Carter
Publisher:
McGraw Hill

Holt Mcdougal Larson Pre-algebra: Student Edition…
Algebra
ISBN:
9780547587776
Author:
HOLT MCDOUGAL
Publisher:
HOLT MCDOUGAL
Glencoe Algebra 1, Student Edition, 9780079039897…
Algebra
ISBN:
9780079039897
Author:
Carter
Publisher:
McGraw Hill
Holt Mcdougal Larson Pre-algebra: Student Edition…
Algebra
ISBN:
9780547587776
Author:
HOLT MCDOUGAL
Publisher:
HOLT MCDOUGAL