
MATLAB: An Introduction with Applications
6th Edition
ISBN: 9781119256830
Author: Amos Gilat
Publisher: John Wiley & Sons Inc
expand_more
expand_more
format_list_bulleted
Related questions
Question
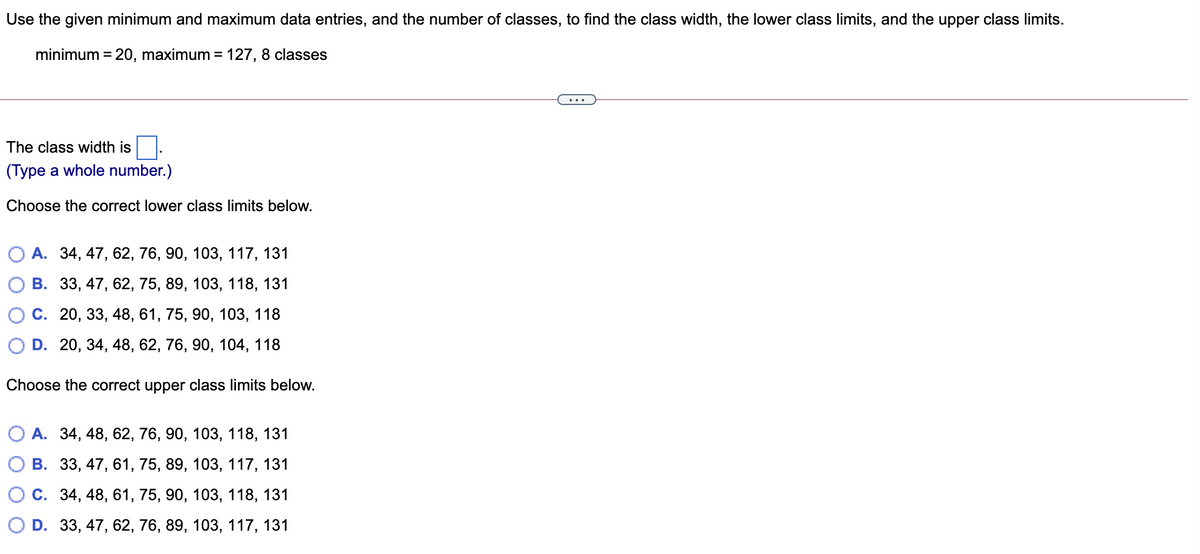

Transcribed Image Text:Use the given minimum and maximum data entries, and the number of classes, to find the class width, the lower class limits, and the upper class limits.
minimum = 20, maximum = 127, 8 classes
...
The class width is
(Type a whole number.)
Choose the correct lower class limits below.
О А. 34, 47, 62, 76, 90, 103, 117, 131
В. 33,47, 62, 75, 89, 103, 118, 131
С. 20, 33, 48, 61, 75, 90, 103, 118
D. 20, 34, 48, 62, 76, 90, 104, 118
Choose the correct upper class limits below.
О А. 34, 48, 62, 76, 90, 103, 118, 131
В. 33, 47, 61, 75, 89, 103, 117, 131
С. 34, 48, 61, 75, 90, 103, 118, 131
D. 33, 47, 62, 76, 89, 103, 117, 131
Expert Solution
This question has been solved!
Explore an expertly crafted, step-by-step solution for a thorough understanding of key concepts.

This is a popular solution

Trending nowThis is a popular solution!

Step by stepSolved in 2 steps with 2 images

Knowledge Booster

Similar questions
- e SC A police officer recorded the following speeds of cars at a certain point on the highway: 55, 55, 49, 62, 68, 56, 55, 84, 52, 73, 58, 58 What was the median speed of the drivers? L A Moving to another question will save this response. MacBook Proarrow_forwardA = 11 B = 2 C= 2 D = 0 F = 1 105, 82, 94.5, 72.5, 92, 91, 52, 86, 100, 96, 98, 109, 96, 98, 95, 72arrow_forward5. Complete the columns below using an initial class boundary of 53.5 and a class width of 4. Each non-work column should have ONLY final values, NOT work or set-up. There are optional columns for work or set-up, which may be left blank. Answer the relative frequency as whole number percentages. 72, 60, 66, 72, 54, 73, 55, 58, 70, 70, 56, 69, 60 Seconds (Class Boundary) (optional) Work Frequency (optional) Work Relative Frequency Cumulative Frequencyarrow_forward
- please need help with statistics questionarrow_forwardPlease provide only part C Please do it in 30 minutesarrow_forward← Use the given minimum and maximum data entries, and the number of classes, to find the class width, the lower class limits, and the upper class limits. minimum = 8, maximum = 94, 6 classes The class width is Choose the correct lower class limits below. OA. 8, 23, 38, 53, 68, 83 OB. 23, 37, 53, 68, 83, 97 OC. 22, 37, 53, 67, 82, 97 OD. 8, 22, 38, 52, 67, 83 Choose the correct upper class limits below. OA. 22, 37, 52, 67, 82, 97 OB. 22, 37, 53, 68, 82, 97 OC. 23, 38, 53, 68, 83,97 OD. 23, 38, 52, 67, 83,97 IEEEarrow_forward
- Use the given minimum and maximum data entries, and the number of classes, to find the class width, the lower class limits, and the upper class limits. minimum = 13, maximum = 78, 6 classes The class width is Choose the correct lower class limits below. OA. 13, 24, 35, 46, 57, 68 OB. 23, 34, 46, 56, 67, 78 O C. 13, 23, 35, 45, 56, 68 OD. 24, 34, 46, 57, 68, 78 Choose the correct upper class limits below. OA. 24, 35, 45, 56, 68, 78 OB. 23, 34, 45, 56, 67, 78 OC. 24, 35, 46, 57, 68, 78 OD. 23, 34, 46, 57, 67, 78arrow_forward3. The number of goals scored by Wayne Gretzky was recorded for seasons 1978 – 1999. (Please note the data set has been ordered from smallest to the largest for your convenience). 5, 9, 11, 16, 23, 23, 31, 38, 40, 40, 41, 46, 51, 52, 54, 55, 62, 71, 73, 87, 92 A. Construct a stem-and-leaf display for the data and describe the shape of the distribution (symmetric, skewed left, skewed right, bell-shaped, etc., any obvious outliers). B. What is the fraction of the data that is less than or equal to 31? C. Given that Ex, = 920 and Ex = 52 436 find the mean and standard deviation. D. Find the (i) median, (ii) Q1, (iii)Q:, (iv) the interquartile range (IQR), (v) the lower and upper fences. E. Construct a Box-plot for the data. What are your conclusions about the shape of the distribution? Compare with the results in Part A. F. Would the mean or the median be the most suitable measure to use to represent the central location of this distribution? Give reasons for your answer.arrow_forwardPlease no written by hand solution and no imagearrow_forward
- Please answer D, E, and F Having a hard timearrow_forwardK A university conducted a survey of 387 undergraduate students regarding satisfaction with student government. Results of the survey are shown in the table by class rank. Complete parts (a) through (d) below. Click the icon to view the table. 美 Data table Satisfied Neutral Not satisfied Total Freshman Sophomore Junior Senior 51 48 62 59 28 20 18 13 23 21 18 26 102 89 98 98 Total D₁ 220 79 88 387arrow_forwardDetermine whether the statement is true or false. If it is false, rewrite it as a true statement. The midpoint of a class is the sum of its lower and upper limits divided by two. Choose the correct answer below. OA. The statement is false. A true statement is "The midpoint of a class is the class frequency divided by the sample size." B. The statement is false. A true statement is "The midpoint of a class is the average of its lower and upper limits." OC. The statement is false. A true statement is "The midpoint of a class is the difference of its lower and upper limits divided by two." O D. The statement is true.arrow_forward
arrow_back_ios
SEE MORE QUESTIONS
arrow_forward_ios
Recommended textbooks for you
- MATLAB: An Introduction with ApplicationsStatisticsISBN:9781119256830Author:Amos GilatPublisher:John Wiley & Sons Inc
 Probability and Statistics for Engineering and th...StatisticsISBN:9781305251809Author:Jay L. DevorePublisher:Cengage Learning
 Statistics for The Behavioral Sciences (MindTap C...StatisticsISBN:9781305504912Author:Frederick J Gravetter, Larry B. WallnauPublisher:Cengage Learning
  Elementary Statistics: Picturing the World (7th E...StatisticsISBN:9780134683416Author:Ron Larson, Betsy FarberPublisher:PEARSON
 The Basic Practice of StatisticsStatisticsISBN:9781319042578Author:David S. Moore, William I. Notz, Michael A. FlignerPublisher:W. H. Freeman
 Introduction to the Practice of StatisticsStatisticsISBN:9781319013387Author:David S. Moore, George P. McCabe, Bruce A. CraigPublisher:W. H. Freeman
MATLAB: An Introduction with Applications
Statistics
ISBN:9781119256830
Author:Amos Gilat
Publisher:John Wiley & Sons Inc
Probability and Statistics for Engineering and th...
Statistics
ISBN:9781305251809
Author:Jay L. Devore
Publisher:Cengage Learning
Statistics for The Behavioral Sciences (MindTap C...
Statistics
ISBN:9781305504912
Author:Frederick J Gravetter, Larry B. Wallnau
Publisher:Cengage Learning
Elementary Statistics: Picturing the World (7th E...
Statistics
ISBN:9780134683416
Author:Ron Larson, Betsy Farber
Publisher:PEARSON
The Basic Practice of Statistics
Statistics
ISBN:9781319042578
Author:David S. Moore, William I. Notz, Michael A. Fligner
Publisher:W. H. Freeman
Introduction to the Practice of Statistics
Statistics
ISBN:9781319013387
Author:David S. Moore, George P. McCabe, Bruce A. Craig
Publisher:W. H. Freeman