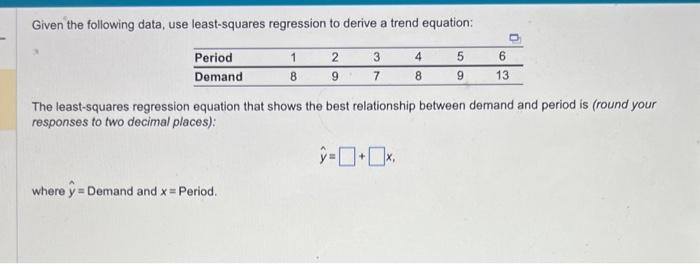
The least-squares regression equation that shows the best relationship between demand and period is (round your responses to two decimal places): y=+x. Demand and y Period


Q: The value of an objective function decreases as it is moved away from the origin O True O False
A: To address issues involving maximizing or reducing a linear objective function while considering a…
Q: Consider the following data for a project to reorganize the office space at Platinum Financial…
A: The Critical Path Method (CPM) is a project management technique used to identify the sequence of…
Q: IBM Sametime is IBM’s telepresence and collaboration environment. Formerly known as Lotus Sametime,…
A: IBM Sametime 9 has changed in several ways to become more social and mobile. One major change is the…
Q: Borges Machine Shop, Inc., has a 1-year contract for the production of 200,000 gear housings for a…
A: Formulae used: Total cost = (Annual Fixed cost + Unit variable cost) * No of units Given:…
Q: The Barberton Municipal division of Road Maintenance is charged with road repair in the city of…
A: Given- Hiring cost= $3,400 per workerFiring cost =$1,800 per workerWages payroll = $6,000 per…
Q: The desired daily output for an assembly line is 480 units. This assembly line will operate 640…
A: Network diagram is a graphical representation of a project which helps to identify the project…
Q: explain disparate impact and discuss how the EEOC tests for disparate impact and provide a detailed…
A: EEOC employers frequently use tests and other choice procedures to evaluate candidates for…
Q: Meritor, a company that makes muffler assemblies for the automotive industry, is committed to the…
A: Data Given, Number of catalytic converters (C) = 15 Average demand (D) = 15 Lead time (L) = 2 Safety…
Q: How important is matching process capabilities to product requirements
A: Employing statistical control techniques to manage a production process is insufficient. A…
Q: For what possible reason would a company take the risk of BYOD?
A: There are several reasons why company might allow employees to use their devices for work, or…
Q: Gerald Glynn manages the Michaels Distribution Center. After careful examination of his database…
A: Workforce scheduling can be characterized as the most common way of laying out the timetables of…
Q: What are some examples of how project management and software development differ between the two…
A: Project management and software development are two distinct disciplines, and keeping in mind that…
Q: Why do the basic EOQ model variations not include the price of an item?
A: Economic order quantity or EOQ refers to the model which helps in calculating the optimal level that…
Q: What is the potential value if they release the product next month?
A: Here, there are two options, for each option, I am determining the expected value, as per this…
Q: IBM Sametime is IBM’s telepresence and collaboration environment. Formerly known as Lotus Sametime,…
A: IBM Sametime is a telepresence and collaboration platform that provides a range of real-time social…
Q: what do you learn from ERP, Leadership and business process.
A: Every business is implementing new technology to improve its working conditions. New technological…
Q: How to make sample of the different contracts between the business and third-party providers…
A: Creating sample contracts for business agreements with third-party providers requires careful…
Q: A farmer can buy four types of plant food. Each barel of mix A contains 35 pounds of phosphoric…
A: LPP stands for Linear Programming Problem, which is a mathematical optimization technique used to…
Q: Justify the need for a skilled project manager on challenging projects.
A: A skilled project manager is essential for managing challenging projects because of multiple…
Q: The time between failures for an electrical appliance is exponentially distributed with a mean of 25…
A: Mean Time Between Failures (MTBF) = 25 months Time (T) = 30 months
Q: I would like you to reflect on your past experiences with conflict in group settings. Your task is…
A: Certainly, conflicts in group settings are common and can arise due to various reasons. Two common…
Q: Gibson Appliances wants to establish an assembly line to manufacture its new product, the Micro…
A: To find: The theoretical minimum number of workstations. Given: Activity Duration Immediate…
Q: Please provide an example of how an engineer keeping track of functional and non-functional demand…
A: Let's say an engineer is working on designing a new software application for a client. To ensure…
Q: Executive Summary (One page – should be written last to focus on key points) Overview of all areas…
A: This report offers guidance to John, a company owner in the Caribbean manufacturing industry, on…
Q: KE Display the data to the right in a Pareto chart. Describe the difference in how the pie chart and…
A: (a) Correct pareto chart is shown in D option. it is because S means summer which has highest…
Q: a) Establish a control chart for monitoring the average weights of the bowling balls in which the…
A: An x-bar control chart is a statistical quality control tool used to monitor the central tendency or…
Q: Sarah and Jennifer have just graduated from college at the University of Washington in Seattle and…
A: A minimum distance problem tends to seek minimum distance via only 1 route.
Q: What serves as the foundation for the Oldham-hackman model of job characteristics
A: The job characteristics model proposed by Hackman and Oldham is one of the few theories that examine…
Q: Sales for the last quarter of the year were good, with tops sales at 3,400 units and pants sales at…
A: To find: The forecast for the demand of product T and product P and what can do to minimize the…
Q: Integrated Health was a large private, nonprofit health care system located in Tempe,Arizona. A year…
A: The case of Integrated Health's failed implementation of the computerized medication administration…
Q: 1. In your own words explain thoroughly (not words from Google), what is the Importance of Ship…
A: Ship Handling and Maneuvering is characterized as the art of legitimate control of a ship while in…
Q: dy used 3 of his money to buy 6 markers. He used the rest of his money to buy 2 markers ncils. What…
A: If he used 2/3 of his money to buy 6 markers, then the cost of each marker is 1/6 of 2/3 of his…
Q: ERP systems underpin many large companies' corporate information systems for a reason. Do…
A: Failure to successfully implement an enterprise resource planning (ERP) system can have a…
Q: What are the 7 Ps to consider in developing a service strategy?
A: There are following 7 Ps which are consider to a service strategy. Product Price Place Promotion…
Q: An Initial solution has been given to the following workcenter layout problem. Each location is 160…
A: Determine the distance by taking mid points: From/to Distances(D)(in square foot) A to B…
Q: Problem #2 a) Develop a CPM diagram for the activities/relationships listed below (assume durations…
A: Find the Calculation methods below: Early Start -- For the first activity Early start is 0 then for…
Q: The Dubuque Cement Company packs 80-pound bags of concrete mix. Time-study data for the filling…
A: Find the given details below: Given details: Element Performance Rating Observation (Seconds)…
Q: Create a partial project schedule using a Gantt Chart (with a minimum of 10 tasks).
A:
Q: Larry’s Bakery operates a chain of ten high-end bakeries. Larry, the owner of these amazing…
A: In order to represent decision-making when faced with many risks in events and their potential…
Q: The table shows the gross requirements of a product. You are also given the following information:…
A: Ans) Net Requirements = Maximum (Gross Requirements - Inventory in previous period,0) For L4L…
Q: The file Housedata.xlsx (pasted below) gives the square footage and sales prices for several houses…
A: Linear regression models the connections between one logical variable and a result variable. These…
Q: recently surveyed 585 mobile application developers and managers, and found that just 35% of mobile…
A: Project management involves breaking down complex projects into manageable tasks, setting deadlines,…
Q: Q4) A manufacturing company preparing to build a new plant is considering three potential locations…
A: Given-
Q: The newly-established pediatric department of a local hospital is in need of full-time nurses who…
A: Hiring and firing are major business activities. Companies need to conduct both of these by critical…
Q: .) A certain analyst wants to solve a problem about a company that wants to minimize the total cost…
A: Transshipment is a special case of transportation problem of linear program. In such problems there…
Q: QUESTION 11 The aim of lean production is to .... A.provide low costs through disciplined…
A: NOTE: You have posted multiple questions and we are allowed to answer only first question as per our…
Q: For the following linear programming problem, determine the optimal solution using the graphical…
A: Ans) Objective Function : Z = -x + 2y Constraints: 1) 6x - 2y <= 3 Put x = 0 -2y = 3 y =…
Q: Is the threat of substitutes for Nike high, medium, or low? Why
A: About- Nike as a brand assumes a vital part in the present sports and games clothing and hardware…
Q: Clearly explain in details, How an entrepreneur interprets failuer or set-backs?
A: Learning is integral to the entrepreneurial process. After significant occurrences, entrepreneurs…
Q: Determine the solution space and the optimum solution of the Reddy Mikks model for the following…
A: Linear Programming is a mathematical and statistical tool that is used in operations management to…


Trending now
This is a popular solution!

Step by step
Solved in 2 steps with 2 images

- Stock market analysts are continually looking for reliable predictors of stock prices. Consider the problem of modeling the price per share of electric utility stocks (Y). Two variables thought to influence this stock price are return on average equity (X1) and annual dividend rate (X2). The stock price, returns on equity, and dividend rates on a randomly selected day for 16 electric utility stocks are provided in the file P13_15.xlsx. Estimate a multiple regression equation using the given data. Interpret each of the estimated regression coefficients. Also, interpret the standard error of estimate and the R-square value for these data.The owner of a restaurant in Bloomington, Indiana, has recorded sales data for the past 19 years. He has also recorded data on potentially relevant variables. The data are listed in the file P13_17.xlsx. a. Estimate a simple regression equation involving annual sales (the dependent variable) and the size of the population residing within 10 miles of the restaurant (the explanatory variable). Interpret R-square for this regression. b. Add another explanatory variableannual advertising expendituresto the regression equation in part a. Estimate and interpret this expanded equation. How does the R-square value for this multiple regression equation compare to that of the simple regression equation estimated in part a? Explain any difference between the two R-square values. How can you use the adjusted R-squares for a comparison of the two equations? c. Add one more explanatory variable to the multiple regression equation estimated in part b. In particular, estimate and interpret the coefficients of a multiple regression equation that includes the previous years advertising expenditure. How does the inclusion of this third explanatory variable affect the R-square, compared to the corresponding values for the equation of part b? Explain any changes in this value. What does the adjusted R-square for the new equation tell you?Do the sales prices of houses in a given community vary systematically with their sizes (as measured in square feet)? Answer this question by estimating a simple regression equation where the sales price of the house is the dependent variable, and the size of the house is the explanatory variable. Use the sample data given in P13_06.xlsx. Interpret your estimated equation, the associated R-square value, and the associated standard error of estimate.
- Suppose that a regional express delivery service company wants to estimate the cost of shipping a package (Y) as a function of cargo type, where cargo type includes the following possibilities: fragile, semifragile, and durable. Costs for 15 randomly chosen packages of approximately the same weight and same distance shipped, but of different cargo types, are provided in the file P13_16.xlsx. a. Estimate a regression equation using the given sample data, and interpret the estimated regression coefficients. b. According to the estimated regression equation, which cargo type is the most costly to ship? Which cargo type is the least costly to ship? c. How well does the estimated equation fit the given sample data? How might the fit be improved? d. Given the estimated regression equation, predict the cost of shipping a package with semifragile cargo.A small computer chip manufacturer wants to forecast monthly ozperating costs as a function of the number of units produced during a month. The company has collected the 16 months of data in the file P13_34.xlsx. a. Determine an equation that can be used to predict monthly production costs from units produced. Are there any outliers? b. How could the regression line obtained in part a be used to determine whether the company was efficient or inefficient during any particular month?The management of a technology company is trying to determine the variable that best explains the variation of employee salaries using a sample of 52 full-time employees; see the file P13_08.xlsx. Estimate simple linear regression equations to identify which of the following has the strongest linear relationship with annual salary: the employees gender, age, number of years of relevant work experience prior to employment at the company, number of years of employment at the company, or number of years of post secondary education. Provide support for your conclusion.
- The file P13_02.xlsx contains five years of monthly data on sales (number of units sold) for a particular company. The company suspects that except for random noise, its sales are growing by a constant percentage each month and will continue to do so for at least the near future. a. Explain briefly whether the plot of the series visually supports the companys suspicion. b. By what percentage are sales increasing each month? c. What is the MAPE for the forecast model in part b? In words, what does it measure? Considering its magnitude, does the model seem to be doing a good job? d. In words, how does the model make forecasts for future months? Specifically, given the forecast value for the last month in the data set, what simple arithmetic could you use to obtain forecasts for the next few months?Management of a home appliance store wants to understand the growth pattern of the monthly sales of a new technology device over the past two years. The managers have recorded the relevant data in the file P13_05.xlsx. Have the sales of this device been growing linearly over the past 24 months? By examining the results of a linear trend line, explain why or why not.The file P13_42.xlsx contains monthly data on consumer revolving credit (in millions of dollars) through credit unions. a. Use these data to forecast consumer revolving credit through credit unions for the next 12 months. Do it in two ways. First, fit an exponential trend to the series. Second, use Holts method with optimized smoothing constants. b. Which of these two methods appears to provide the best forecasts? Answer by comparing their MAPE values.
- The file P13_22.xlsx contains total monthly U.S. retail sales data. While holding out the final six months of observations for validation purposes, use the method of moving averages with a carefully chosen span to forecast U.S. retail sales in the next year. Comment on the performance of your model. What makes this time series more challenging to forecast?The file P13_29.xlsx contains monthly time series data for total U.S. retail sales of building materials (which includes retail sales of building materials, hardware and garden supply stores, and mobile home dealers). a. Is seasonality present in these data? If so, characterize the seasonality pattern. b. Use Winters method to forecast this series with smoothing constants = = 0.1 and = 0.3. Does the forecast series seem to track the seasonal pattern well? What are your forecasts for the next 12 months?The file P13_26.xlsx contains the monthly number of airline tickets sold by the CareFree Travel Agency. a. Create a time series chart of the data. Based on what you see, which of the exponential smoothing models do you think will provide the best forecasting model? Why? b. Use simple exponential smoothing to forecast these data, using a smoothing constant of 0.1. c. Repeat part b, but search for the smoothing constant that makes RMSE as small as possible. Does it make much of an improvement over the model in part b?

