The manager of a grocery store has selected a random sample of 100 customers. The average length of ti these 100 customers to check out was 3.0 minutes. It is known that the standard deviation of the checkou minute.
The manager of a grocery store has selected a random sample of 100 customers. The average length of ti these 100 customers to check out was 3.0 minutes. It is known that the standard deviation of the checkou minute.

Glencoe Algebra 1, Student Edition, 9780079039897, 0079039898, 2018
18th Edition
ISBN:9780079039897
Author:Carter
Publisher:Carter
Chapter10: Statistics
Section10.3: Measures Of Spread
Problem 26PFA

Related questions
Question
100%
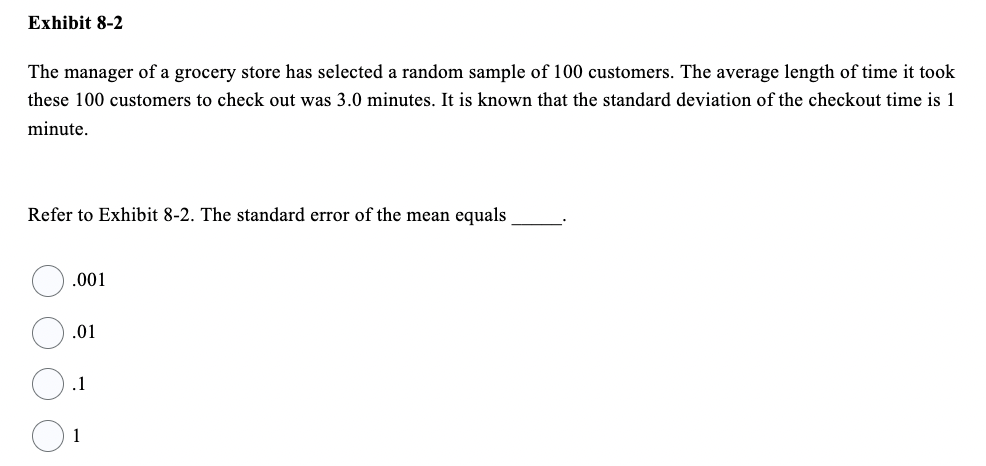
Transcribed Image Text:Exhibit 8-2
The manager of a grocery store has selected a random sample of 100 customers. The average length of time it took
these 100 customers to check out was 3.0 minutes. It is known that the standard deviation of the checkout time is 1
minute.
Refer to Exhibit 8-2. The standard error of the mean equals
.001
.01
1
Expert Solution
This question has been solved!
Explore an expertly crafted, step-by-step solution for a thorough understanding of key concepts.

Step by step
Solved in 2 steps

Recommended textbooks for you
Glencoe Algebra 1, Student Edition, 9780079039897…
Algebra
ISBN:
9780079039897
Author:
Carter
Publisher:
McGraw Hill
Glencoe Algebra 1, Student Edition, 9780079039897…
Algebra
ISBN:
9780079039897
Author:
Carter
Publisher:
McGraw Hill