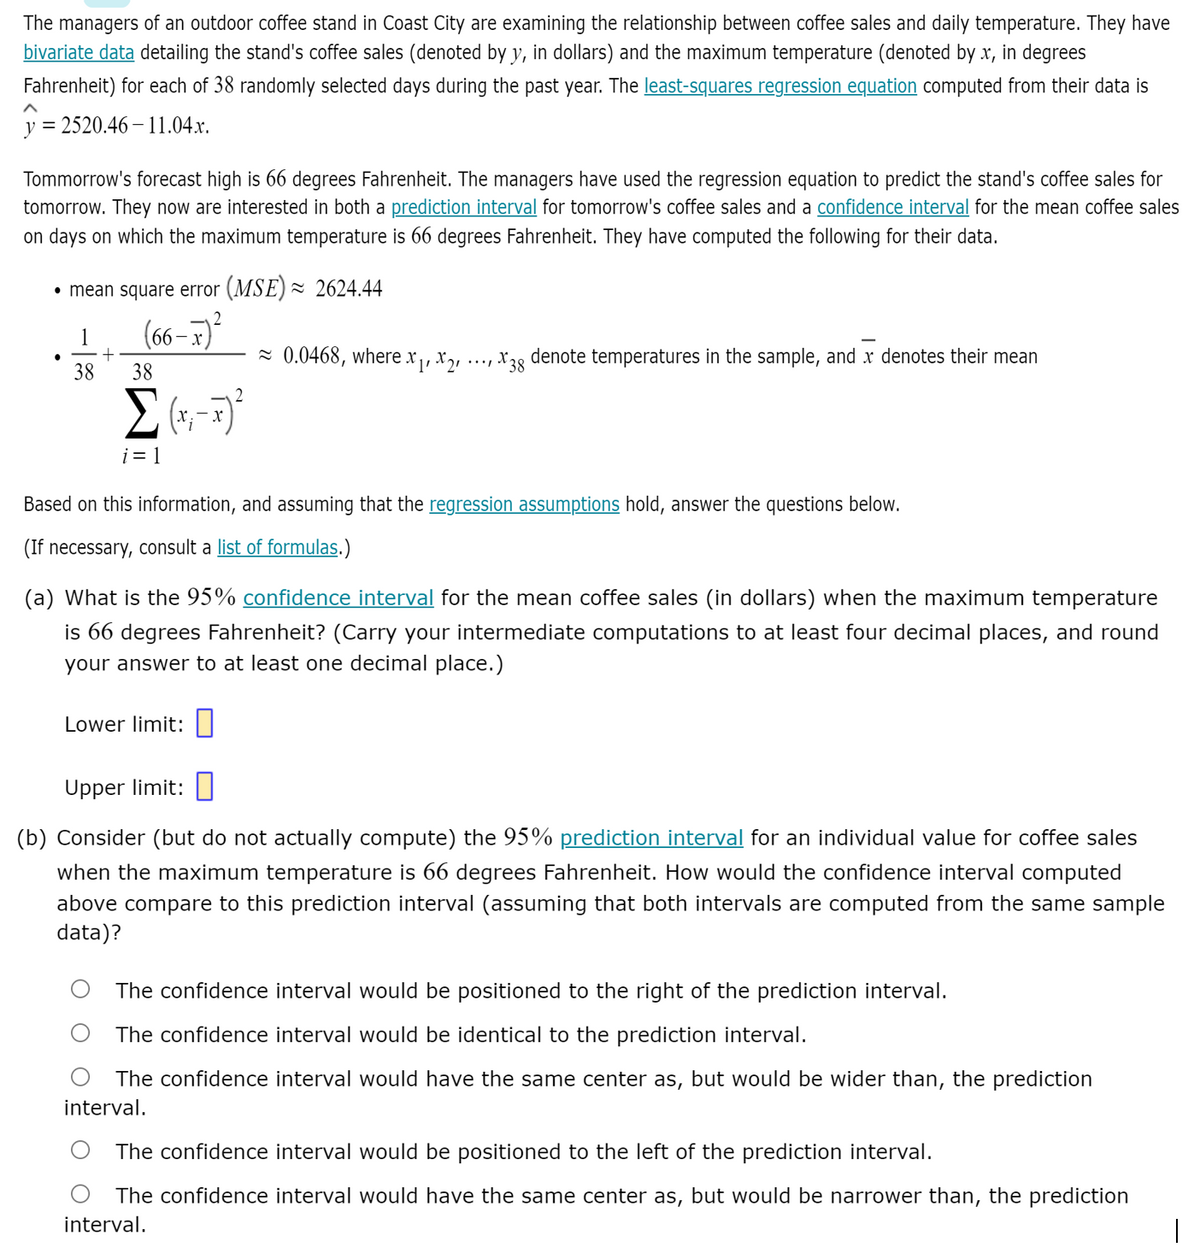
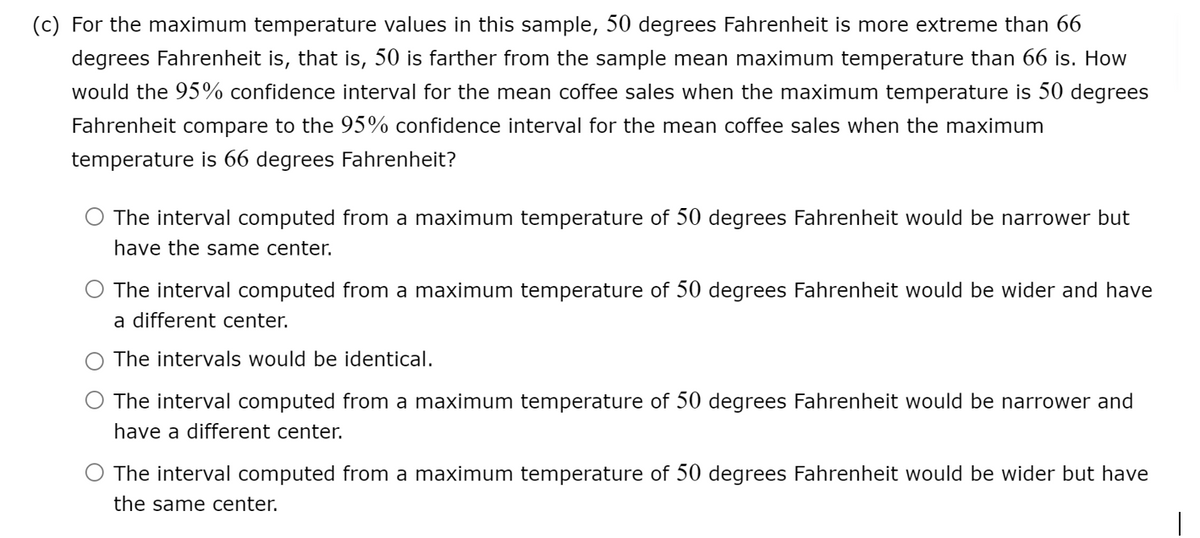
The managers of an outdoor coffee stand in Coast City are examining the relationship between coffee sales and daily temperature. They have bivariate data detailing the stand's coffee sales (denoted by y, in dollars) and the maximum temperature (denoted by x, in degrees Fahrenheit) for each of 38 randomly selected days during the past year. The least-squares regression equation computed from their data is y = 2520.46 – 11.04.x. Tommorrow's forecast high is 66 degrees Fahrenheit. The managers have used the regression equation to predict the stand's coffee sales for tomorrow. They now are interested in both a prediction interval for tomorrow's coffee sales and a confidence interval for the mean coffee sales on days on which the maximum temperature is 66 degrees Fahrenheit. They have computed the following for their data. • mean square error (MSE) = 2624.44 (66 –7)? 1 = 0.0468, wherex, X21 X38 denote temperatures in the sample, and x denotes their mean 38 38 i = 1 Based on this information, and assuming that the regression assumptions hold, answer the questions below. (If necessary, consult a list of formulas.) (a) What is the 95% confidence interval for the mean coffee sales (in dollars) when the maximum temperature is 66 degrees Fahrenheit? (Carry your intermediate computations to at least four decimal places, and round your answer to at least one decimal place.) Lower limit:| Upper limit: (b) Consider (but do not actually compute) the 95% prediction interval for an individual value for coffee sales when the maximum temperature is 66 degrees Fahrenheit. How would the confidence interval computed above compare to this prediction interval (assuming that both intervals are computed from the same sample data)? The confidence interval would be positioned to the right of the prediction interval. The confidence interval would be identical to the prediction interval. The confidence interval would have the same center as, but would be wider than, the prediction interval. The confidence interval would be positioned to the left of the prediction interval. The confidence interval would have the same center as, but would be narrower than, the prediction interval.


Correlation
Correlation defines a relationship between two independent variables. It tells the degree to which variables move in relation to each other. When two sets of data are related to each other, there is a correlation between them.
Linear Correlation
A correlation is used to determine the relationships between numerical and categorical variables. In other words, it is an indicator of how things are connected to one another. The correlation analysis is the study of how variables are related.
Regression Analysis
Regression analysis is a statistical method in which it estimates the relationship between a dependent variable and one or more independent variable. In simple terms dependent variable is called as outcome variable and independent variable is called as predictors. Regression analysis is one of the methods to find the trends in data. The independent variable used in Regression analysis is named Predictor variable. It offers data of an associated dependent variable regarding a particular outcome.


Trending now
This is a popular solution!

Step by step
Solved in 2 steps


