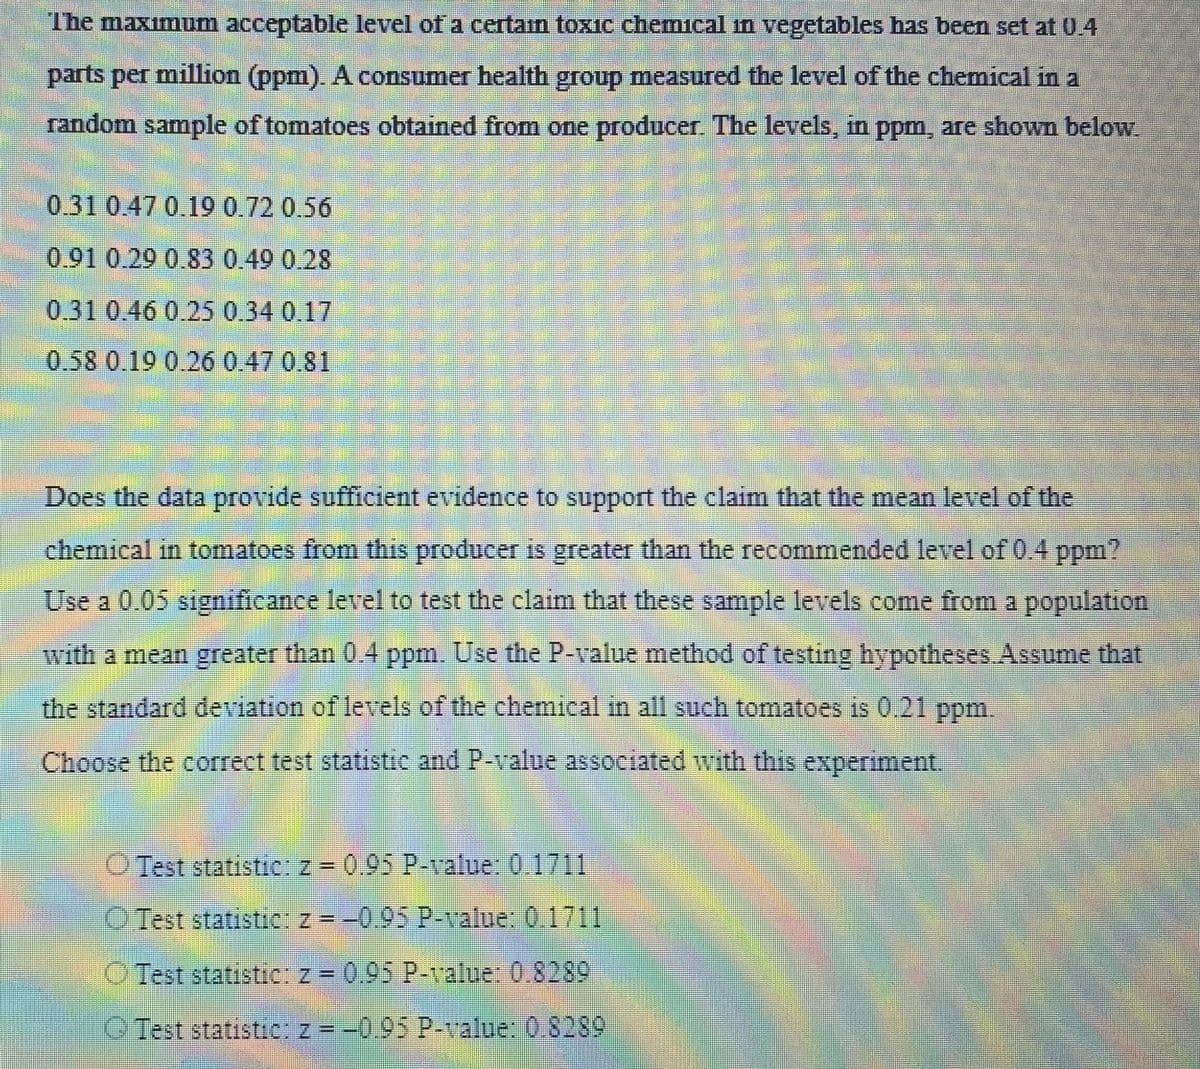
The maximum acceptable level of a certain toxic chemical in vegetables has been set at 0.4 parts per million (ppm). A consumer health group measured the level of the chemical in a random sample of tomatoes obtained from one producer. The levels, in ppm, are shown below. 0.31 0.47 0.19 0.72 0.56 0.91 0.29 0.83 0.49 0.28 0.31 0.46 0.25 0.34 0.17 0.58 0.19 0.26 0.47 0.81 Does the data provide sufficient evidence to support the claim that the mean level of the chemical in tomatoes from this producer is greater than the recommended level of 0.4 ppm? Use a 0.05 significance level to test the claim that these sample levels come from a population with a mean greater than 0.4 ppm. Use the P-value method of testing hypotheses. Assume that the standard deviation of levels of the chemical in all such tomatoes is 0.21 ppm. Choose the correct test statistic and P-value associated with this experiment. O Test statistic: z = 0.95 P-value: 0.1711 O Test statistic: z = -0.95 P-value: 0.1711 O Test statistic: z = 0.95 P-value: 0.8289 Test statistic: z = -0.95 P-value: 0.8289
The maximum acceptable level of a certain toxic chemical in vegetables has been set at 0.4 parts per million (ppm). A consumer health group measured the level of the chemical in a random sample of tomatoes obtained from one producer. The levels, in ppm, are shown below. 0.31 0.47 0.19 0.72 0.56 0.91 0.29 0.83 0.49 0.28 0.31 0.46 0.25 0.34 0.17 0.58 0.19 0.26 0.47 0.81 Does the data provide sufficient evidence to support the claim that the mean level of the chemical in tomatoes from this producer is greater than the recommended level of 0.4 ppm? Use a 0.05 significance level to test the claim that these sample levels come from a population with a mean greater than 0.4 ppm. Use the P-value method of testing hypotheses. Assume that the standard deviation of levels of the chemical in all such tomatoes is 0.21 ppm. Choose the correct test statistic and P-value associated with this experiment. O Test statistic: z = 0.95 P-value: 0.1711 O Test statistic: z = -0.95 P-value: 0.1711 O Test statistic: z = 0.95 P-value: 0.8289 Test statistic: z = -0.95 P-value: 0.8289
Mathematics For Machine Technology
8th Edition
ISBN:9781337798310
Author:Peterson, John.
Publisher:Peterson, John.
Chapter29: Tolerance, Clearance, And Interference
Section: Chapter Questions
Problem 8A
Related questions
Question
100%
Use the data to identify the correct response.

Transcribed Image Text:The maximum acceptable level of a certain toxic chemical in vegetables has been set at 0.4
parts per million (ppm). A consumer health group measured the level of the chemical in a
random sample of tomatoes obtained from one producer. The levels, in ppm, are shown below.
0.31 0.47 0.19 0.72 0.56
0.91 0.29 0.83 0.49 0.28
0.31 0.46 0.25 0.34 0.17
0.58 0.19 0.26 0.47 0.81
Does the data provide sufficient evidence to support the claim that the mean level of the
chemical in tomatoes from this producer is greater than the recommended level of 0.4 ppm?
Use a 0.05 significance level to test the claim that these sample levels come from a population
with a mean greater than 0.4 ppm. Use the P-value method of testing hypotheses. Assume that
the standard deviation of levels of the chemical in all such tomatoes is 0.21 ppm.
Choose the correct test statistic and P-value associated with this experiment.
Test statistic: z = 0.95 P-value: 0.1711
Test statistic: z = -0.95 P-value: 0.1711
O Test statistic: z = 0.95 P-value: 0.8289
Test statistic: z = -0.95 P-value: 0.8289
Expert Solution
This question has been solved!
Explore an expertly crafted, step-by-step solution for a thorough understanding of key concepts.
This is a popular solution!
Trending now
This is a popular solution!
Step by step
Solved in 2 steps with 1 images

Recommended textbooks for you

Mathematics For Machine Technology
Advanced Math
ISBN:
9781337798310
Author:
Peterson, John.
Publisher:
Cengage Learning,

Mathematics For Machine Technology
Advanced Math
ISBN:
9781337798310
Author:
Peterson, John.
Publisher:
Cengage Learning,