The mean number of sick days an employee takes per year is believed to be about 10. Members of a personnel department do not believe this figure. They randomly survey 8 employees. The number of sick days they took for the past year are as follows: 11; 5; 14; 3; 10; 9; 8; 9. Let X = the number of sick days they took for the past year. Should the personnel team believe that the mean number is about 10? Conduct a hypothesis test at the 5% level. Note: If you are using a Student's t-distribution for the problem, you may assume that the underlying population is normally distributed. (In general, you must first prove that assumption, though.) O Part (a) O Part (b) O Part (c) O Part (d) O Part (e) What is the test statistic? (If using the z distribution round your answers to two decimal places, and if using the t distribution round your answers to three decimal places.) -Select-v= O Part () What is the p-value? O p-value < 0.010 O 0.010 < p-value <0.050 O 0.050 < p-value < 0.100 O p-value > 0.100 Explain what the p-value means for this problem. O If Ho is true, then there is a chance equal to the p-value the average number of sick days for employees is not at least as different from 10 as the mean of the sample is different from 10. O If Ho is false, then there is a chance equal to the p-value that the average number of sick days for employees is at least as different from 10 as the mean of the sample is different from 10. O If Ho is false, then there is a chance equal to the p-value the average number of sick days for employees is not at least as different from 10 as the mean of the sample is different from 10. O If Ho is true, then there is a chance equal to the p-value that the average number of sick days for employees is at least as different from 10 as the mean of the sample is different from 10.
The mean number of sick days an employee takes per year is believed to be about 10. Members of a personnel department do not believe this figure. They randomly survey 8 employees. The number of sick days they took for the past year are as follows: 11; 5; 14; 3; 10; 9; 8; 9. Let X = the number of sick days they took for the past year. Should the personnel team believe that the mean number is about 10? Conduct a hypothesis test at the 5% level. Note: If you are using a Student's t-distribution for the problem, you may assume that the underlying population is normally distributed. (In general, you must first prove that assumption, though.) O Part (a) O Part (b) O Part (c) O Part (d) O Part (e) What is the test statistic? (If using the z distribution round your answers to two decimal places, and if using the t distribution round your answers to three decimal places.) -Select-v= O Part () What is the p-value? O p-value < 0.010 O 0.010 < p-value <0.050 O 0.050 < p-value < 0.100 O p-value > 0.100 Explain what the p-value means for this problem. O If Ho is true, then there is a chance equal to the p-value the average number of sick days for employees is not at least as different from 10 as the mean of the sample is different from 10. O If Ho is false, then there is a chance equal to the p-value that the average number of sick days for employees is at least as different from 10 as the mean of the sample is different from 10. O If Ho is false, then there is a chance equal to the p-value the average number of sick days for employees is not at least as different from 10 as the mean of the sample is different from 10. O If Ho is true, then there is a chance equal to the p-value that the average number of sick days for employees is at least as different from 10 as the mean of the sample is different from 10.

Glencoe Algebra 1, Student Edition, 9780079039897, 0079039898, 2018
18th Edition
ISBN:9780079039897
Author:Carter
Publisher:Carter
Chapter10: Statistics
Section10.4: Distributions Of Data
Problem 19PFA

Related questions

Question
I'm struggling with getting this correct and need help
note: for part E, the select options are either z or t distribution (must pick one)
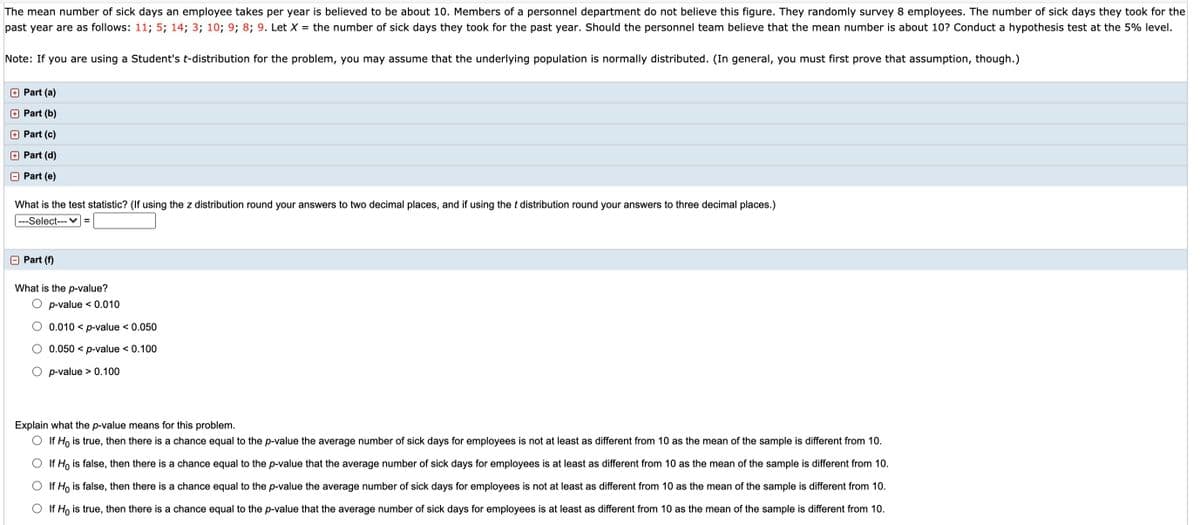
Transcribed Image Text:The mean number of sick days an employee takes per year is believed to be about 10. Members of a personnel department do not believe this figure. They randomly survey 8 employees. The number of sick days they took for the
past year are as follows: 11; 5; 14; 3; 10; 9; 8; 9. Let X = the number of sick days they took for the past year. Should the personnel team believe that the mean number is about 10? Conduct a hypothesis test at the 5% level.
Note: If you are using a Student's t-distribution for the problem, you may assume that the underlying population is normally distributed. (In general, you must first prove that assumption, though.)
+ Part (a)
O Part (b)
O Part (c)
O Part (d)
O Part (e)
What is the test statistic? (If using the z distribution round your answers to two decimal places, and if using the t distribution round your answers to three decimal places.)
|---Select---v =
O Part (f)
What is the p-value?
O p-value < 0.010
0.010 < p-value < 0.050
0.050 < p-value < 0.100
p-value > 0.100
Explain what the p-value means for this problem.
O If Ho is true, then there is a chance equal to the p-value the average number of sick days for employees is not at least as different from 10 as the mean of the sample is different from 10.
If Ho is false, then there is a chance equal to the p-value that the average number of sick days for employees is at least as different from 10 as the mean of the sample is different from 10.
If Ho is false, then there is a chance equal to the p-value the average number of sick days for employees is not at least as different from 10 as the mean of the sample is different from 10.
O If H, is true, then there is a chance equal to the p-value that the average number of sick days for employees is at least as different from 10 as the mean of the sample is different from 10.
Expert Solution
This question has been solved!
Explore an expertly crafted, step-by-step solution for a thorough understanding of key concepts.

This is a popular solution!

Trending now
This is a popular solution!

Step by step
Solved in 2 steps with 2 images

Knowledge Booster


Learn more about
Need a deep-dive on the concept behind this application? Look no further. Learn more about this topic, statistics and related others by exploring similar questions and additional content below.Recommended textbooks for you
Glencoe Algebra 1, Student Edition, 9780079039897…
Algebra
ISBN:
9780079039897
Author:
Carter
Publisher:
McGraw Hill
Glencoe Algebra 1, Student Edition, 9780079039897…
Algebra
ISBN:
9780079039897
Author:
Carter
Publisher:
McGraw Hill