The heart rates before and after running a race (in beats per minute) of a sample of four athletes are shown in the following table: Heart rate after Heart rate before 50 52 56 53 Athlete 1 120 3 4 129 134 123 The aim of the experiment was to determine whether the population mean heart rate after a race is more than 70 beats per minute greater than before the race. Use the appropriate hypotheses test to determine whether the population mean heart rate after a race is more than 70 beats per minute greater than before the race. Use a = 0.05 and also find the approximate p-value. Also mention any assumptions made. 1.4 1.5 Using your answer in 1.4), comment on whether you are subject to a Type I or a Type II| error. Describe this error in the context of this problem. 1.6 Estimate the difference in the mean heart rate by calculating a 90% confidence interval for the data. Use this result to determine whether the population mean heart rate after a race is more than 70 beats per minute greater than before the race.
The heart rates before and after running a race (in beats per minute) of a sample of four athletes are shown in the following table: Heart rate after Heart rate before 50 52 56 53 Athlete 1 120 3 4 129 134 123 The aim of the experiment was to determine whether the population mean heart rate after a race is more than 70 beats per minute greater than before the race. Use the appropriate hypotheses test to determine whether the population mean heart rate after a race is more than 70 beats per minute greater than before the race. Use a = 0.05 and also find the approximate p-value. Also mention any assumptions made. 1.4 1.5 Using your answer in 1.4), comment on whether you are subject to a Type I or a Type II| error. Describe this error in the context of this problem. 1.6 Estimate the difference in the mean heart rate by calculating a 90% confidence interval for the data. Use this result to determine whether the population mean heart rate after a race is more than 70 beats per minute greater than before the race.

Glencoe Algebra 1, Student Edition, 9780079039897, 0079039898, 2018
18th Edition
ISBN:9780079039897
Author:Carter
Publisher:Carter
Chapter10: Statistics
Section10.1: Measures Of Center
Problem 9PPS

Related questions
Question
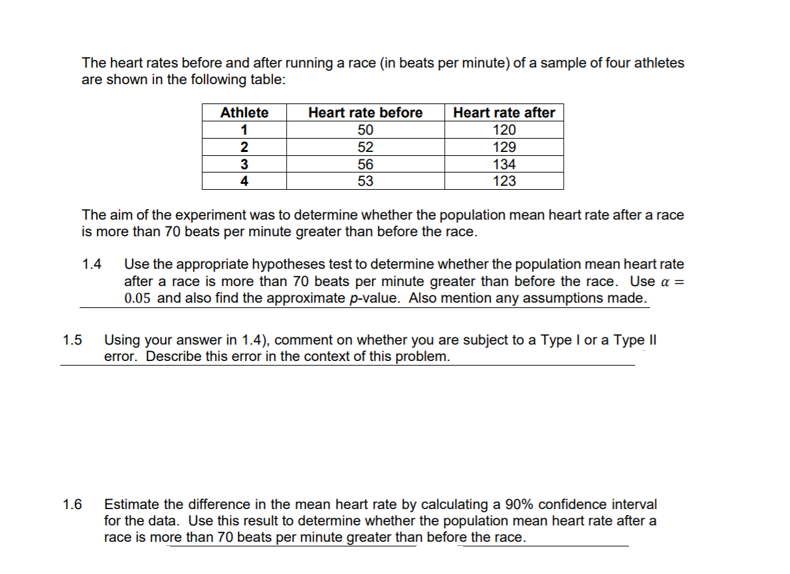
Transcribed Image Text:The heart rates before and after running a race (in beats per minute) of a sample of four athletes
are shown in the following table:
Athlete
Heart rate before
Heart rate after
1
50
120
52
129
134
123
2
3
56
53
4
The aim of the experiment was to determine whether the population mean heart rate after a race
is more than 70 beats per minute greater than before the race.
1.4 Use the appropriate hypotheses test to determine whether the population mean heart rate
after a race is more than 70 beats per minute greater than before the race. Use a =
0.05 and also find the approximate p-value. Also mention any assumptions made.
1.5 Using your answer in 1.4), comment on whether you are subject to a Type I or a Type II
error. Describe this error in the context of this problem.
1.6 Estimate the difference in the mean heart rate by calculating a 90% confidence interval
for the data. Use this result to determine whether the population mean heart rate after a
race is more than 70 beats per minute greater than before the race.
Expert Solution
This question has been solved!
Explore an expertly crafted, step-by-step solution for a thorough understanding of key concepts.

Step by step
Solved in 5 steps with 1 images

Knowledge Booster


Learn more about
Need a deep-dive on the concept behind this application? Look no further. Learn more about this topic, statistics and related others by exploring similar questions and additional content below.Recommended textbooks for you
Glencoe Algebra 1, Student Edition, 9780079039897…
Algebra
ISBN:
9780079039897
Author:
Carter
Publisher:
McGraw Hill
Glencoe Algebra 1, Student Edition, 9780079039897…
Algebra
ISBN:
9780079039897
Author:
Carter
Publisher:
McGraw Hill