The National Football League (NFL) records a variety of performance data for individuals and teams. To investigate the importance of passing on the percentage of games won by a team, the following data show the average number of passing yards per attempt (Yds/Att) and the percentage of games won (WinPct) for a random sample of 10 NFL teams for the 2011 season (NFL website). Team Yds/Att WinPct Arizona Cardinals 6.9 44 Atlanta Falcons 8.0 69 Carolina Panthers 5.3 19 Chicago Bears 8.3 75 Dallas Cowboys 5.4 26 New England Patriots 7.1 54 Philadelphia Eagles 8.4 79 Seattle Seahawks 8.4 80 St. Louis Rams 6.1 33 Tampa Bay Buccaneers 7.8 70 a. Choose the correct a scatter diagram with the number of passing yards per attempt on the horizontal axis and the percentage of games won on the vertical axis. A. В. Win Pct WinPct | 80- 80- : 70- 70- 60 60- 50 50- 40- 40- 30- 30- 20- 20- 10 10- 8 8. 9
The National Football League (NFL) records a variety of performance data for individuals and teams. To investigate the importance of passing on the percentage of games won by a team, the following data show the average number of passing yards per attempt (Yds/Att) and the percentage of games won (WinPct) for a random sample of 10 NFL teams for the 2011 season (NFL website). Team Yds/Att WinPct Arizona Cardinals 6.9 44 Atlanta Falcons 8.0 69 Carolina Panthers 5.3 19 Chicago Bears 8.3 75 Dallas Cowboys 5.4 26 New England Patriots 7.1 54 Philadelphia Eagles 8.4 79 Seattle Seahawks 8.4 80 St. Louis Rams 6.1 33 Tampa Bay Buccaneers 7.8 70 a. Choose the correct a scatter diagram with the number of passing yards per attempt on the horizontal axis and the percentage of games won on the vertical axis. A. В. Win Pct WinPct | 80- 80- : 70- 70- 60 60- 50 50- 40- 40- 30- 30- 20- 20- 10 10- 8 8. 9

Glencoe Algebra 1, Student Edition, 9780079039897, 0079039898, 2018
18th Edition
ISBN:9780079039897
Author:Carter
Publisher:Carter
Chapter10: Statistics
Section10.6: Summarizing Categorical Data
Problem 10CYU

Related questions
Question
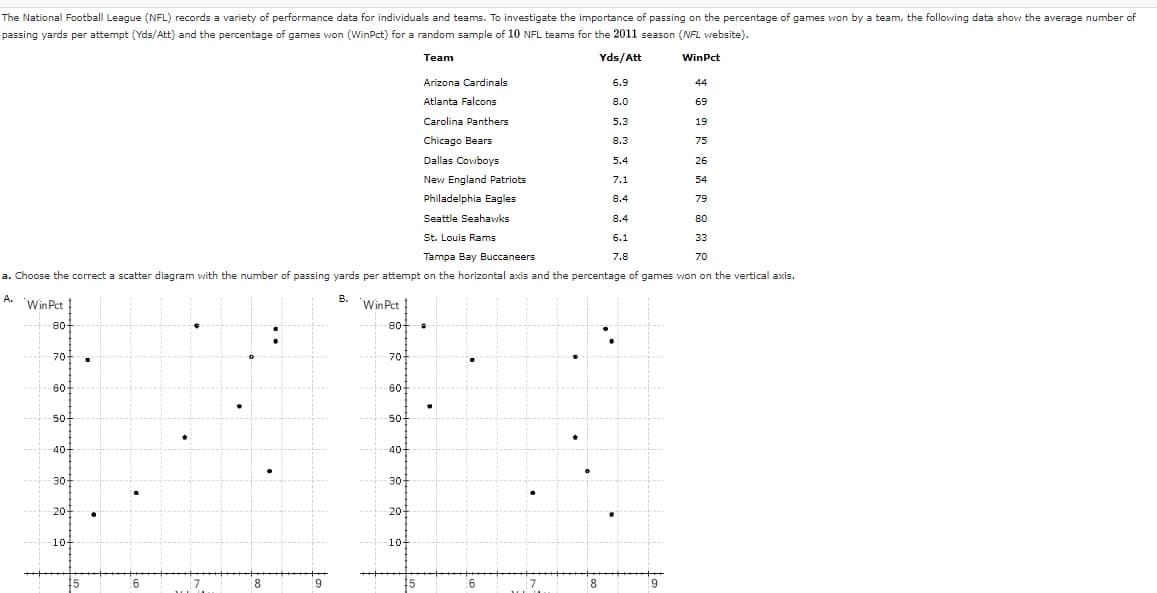
Transcribed Image Text:The National Football League (NFL) records a variety of performance data for individuals and teams. To investigate the importance of passing on the percentage of games won by a team, the following data show the average number of
passing yards per attempt (Yds/Att) and the percentage of games won (WinPct) for a random sample of 10 NFL teams for the 2011 season (NFL website).
Team
Yds/Att
WinPct
Arizona Cardinals
6.9
44
Atlanta Falcons
8.0
69
Carolina Panthers
5.3
19
Chicago Bears
8.3
75
Dallas Cowboys
5.4
26
New England Patriots
7.1
54
Philadelphia Eagles
8.4
79
Seattle Seahawks
8.4
80
St. Louis Rams
6.1
33
Tampa Bay Buccaneers
7.8
70
a. Choose the correct a scatter diagram with the number of passing yards per attempt on the horizontal axis and the percentage of games won on the vertical axis.
A.
в.
Win Pct |
Win Pct
80-
80-
:
70-
70-
60-
60
50
50-
40-
40-
30-
30
20
20-
10
10-
8
8.
Expert Solution
This question has been solved!
Explore an expertly crafted, step-by-step solution for a thorough understanding of key concepts.

Step by step
Solved in 3 steps with 2 images

Recommended textbooks for you
Glencoe Algebra 1, Student Edition, 9780079039897…
Algebra
ISBN:
9780079039897
Author:
Carter
Publisher:
McGraw Hill

Holt Mcdougal Larson Pre-algebra: Student Edition…
Algebra
ISBN:
9780547587776
Author:
HOLT MCDOUGAL
Publisher:
HOLT MCDOUGAL
Glencoe Algebra 1, Student Edition, 9780079039897…
Algebra
ISBN:
9780079039897
Author:
Carter
Publisher:
McGraw Hill
Holt Mcdougal Larson Pre-algebra: Student Edition…
Algebra
ISBN:
9780547587776
Author:
HOLT MCDOUGAL
Publisher:
HOLT MCDOUGAL