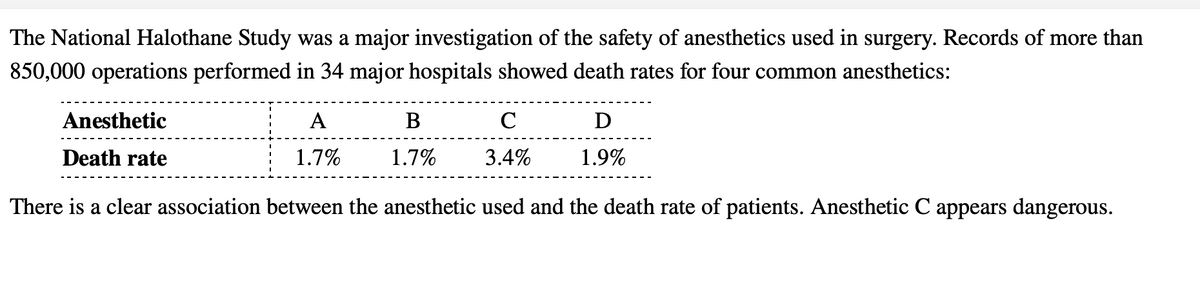
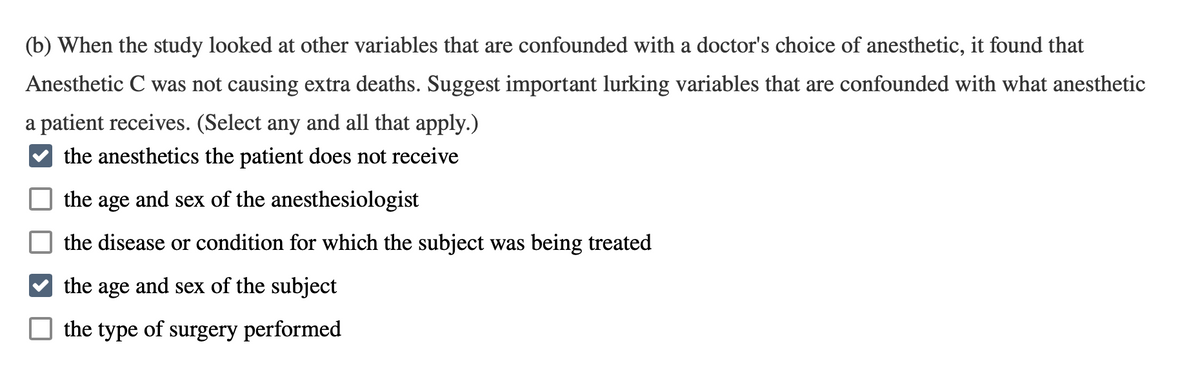
The National Halothane Study was a major investigation of the safety of anesthetics used in surgery. Records of more than 850,000 operations performed in 34 major hospitals showed death rates for four common anesthetics: Anesthetic A B C D Death rate 1.7% 1.7% 3.4% 1.9% There is a clear association between the anesthetic used and the death rate of patients. Anesthetic C appears dangerous.


Q: A small University wanted to determine whether a wellness program that focused on walking to enhance…
A: Definition: The case group: A case group is defined as it is helps to compare two…
Q: A recent Gallup poll of 557 adults who flew in the past year collected the number 1 complaints about…
A: (a) % found nothing to dislike Total number of people surveyed = 567
Q: Which alternative distributes the benefits and burdens most fairly among the employees?…
A: INTRODUCTION: Any organization must prioritize employee motivation. Employees are motivated by it to…
Q: The case study Customer Support, Inc. (CSUP) is a large corporation with international clients…
A: Project management methodologies refers to different techniques which are adhered to while…
Q: You have an employee who is asking about the FMLA because she needs to take leave from work to care…
A: Under the Family and Medical Leave Act (FMLA), covered businesses should give qualified workers…
Q: Describe the method of sensitivity analysis?
A: Sensitivity analysis is the study in which the uncertainty in the output of the model will be…
Q: Make recommendations regarding the number of technicians to be used when OEI reaches 20 and then 30…
A: Hi there! Thank you for posting the question. As your question has more than 3 parts, we have solved…
Q: How precautions for coronavirus is Important for Companies?
A: Coronavirus is a deadly disease that started from Wuhan China and spread to almost all the countries…
Q: Discuss the philosophy and purpose of diagnosis in organization development (OD). Explain the role…
A: Organizational development refers to the study of how an organization successfully brings about…
Q: The widths of 79 randomly selected window blinds were found to have a standard deviation of 2.37.…
A: It is given that standard deviation of 79 randomly selected blinds is 2.3. Now the 95% confidence…
Q: How the the survey scale is used to identify risks in a business context?
A: SURVEY SCALE: They are indexes that help to measure variables that aren't exactly directly observed…
Q: Health workers are at the front line of the COVID-19 response and as such are exposed to different…
A: Wellbeing laborers are at the forefront of the COVID-19 episode reaction and as such are presented…
Q: From an action research perspective, how are members of the client organization involved in…
A: Action research is an approach in which the researcher and the client collaborate to understand the…
Q: The Covid-19 has changed the working environment around the globe. Many companies swiftly moving…
A: Training need analysis is the process of identifying the areas in which training materials should be…
Q: Analyse the principles, tools and techniques of TQM and six sigma
A: Principles of TQM Client-Centric Approach – Consumers are a definitive appointed authority to…
Q: In managing the risks associated with statistically based research decisions, which is NOT likely…
A: Research is an organized and planned method of finding answers to the questions. It is a long…
Q: What situation at a workplace could benefit from a Six Sigma program and why
A: Six Sigma: Six Sigma is a statistical methodology that helps to measure the quality…
Q: Determine the critical values for the confidence interval for the population standard deviation from…
A: On a graph, a critical value is a line that divides the graph into pieces. The "rejection zone" is…
Q: Explain why we need to use a pareto chart to achieve total quality in the hospitality industry?
A: Pareto chart is the visual representation of defects or problems that shows their frequency and…
Q: subject : quality control topic: six sigma The increased global manufacturing competition…
A: Introduction: Quality can be defined as the standard of a product or a service and it is the extent…
Q: How is the Statistical process control a major statistical tool of quality control?
A: Quality control is described as a method through which quality of a product can be improved or…
Q: Under what circumstances might an employer need to maintain an OSHA injury/illness log for persons…
A: OSHA is occupational health and safety act developed by the government and it must be implemented in…
Q: What is the effectiveness of 3M™Health Information System Division Potentially Preventable…
A: The 3M Potentially Preventable Readmissions (PPR) methodology identifies inpatient readmissions that…
Q: the differences between traditional quality management and TQM and why TQM is bette
A: The idea, execution, and analysis of conventional and total quality management vary. administrators…
Q: You are an owner of a restaurant in the city. Your employees consist of a manager, a chef, assistant…
A: Criteria for evaluating the performance: To track the efficiency of the waitress/waiters, the…
Q: Describe the Six Sigma methodology.
A: Six Sigma is a methodology that involves the use of various tools while improving the process…
Q: In a village of 10,000 population there has been increasing cases of Cholera during the month of…
A: 1. Observational Epidemiology refers back to the inference approximately the etiological elements…
Q: The temperature of a burrito served to a customer in a local Mexican restaurant A: Discrete B;…
A: Continous
Q: Process control and acceptance sampling are two types of quality control that organisations utilise.…
A: Process control can be defined as the capability of monitoring and adjusting the process to achieve…
Q: What is Six - Sigma?
A: Disclaimer: Since you have asked multiple question, so we will solve the first question for you. If…
Q: Explain the applications of Statistical Quality control with referance to the healthcare system
A: A Small introduction about Quality Control Quality control implies how an organization estimates…
Q: 35) Quality improvement in clinical governance is achieved through which of the following: Acting…
A: A root cause is characterized as a component that caused a nonconformance and ought to be for all…
Q: 1. Identify the issue and explain how it relates to the training and development program. 2.…
A: The training is the act , process or method of one that trains , develop skills ,knowledge or…
Q: Using your own words, explain in brief the idea behind six-sigma concept, and how it does benefit…
A: Six sigma is a set of quality control tools that are used for eliminating defects in the processes,…
Q: Identifying Dependent, Independent and controlled Variables and draw an example of model of study…
A: Cause and effect allude to a connection between two peculiarities where one peculiarity is the…
Q: Office Equipment, Inc. (OEI) leases automatic mailing machines to business customers in Fort Wayne,…
A: 1. l = 1 call/50 hours = 0.02 calls per hour 2. Mean service time = travel time + repair time = 1 +…
Q: List in a cause-and-effect order the four categories of measures typically found in a balance…
A: A balanced scorecard is a strategic management performance statistic that assists businesses in…
Q: Derek runs the finance department for a software company and wants to measure a job candidate's…
A: Tests are conducted to determine the suitability of the candidates in various aspects, such as basic…
Q: Total quality management practices and their impact on performance. Case study of Royal Jordanian…
A: As per the case study Total quality management focus on maintaining quality.
Q: When do you think that sourcing neurodiverse talent is most appropriate?
A: People in the marketing mix are one of the most important elements which decide the success or…


Trending now
This is a popular solution!

Step by step
Solved in 2 steps


- Cousins Jeri Lynn DeBose, Tish Hoover, and Josephine (Joey) Parks looked forward to meeting up during the Christmas holidays to compare notes on the results of midyear teacher evaluations. All were public school teachers in districts scattered over the state. In the pressured search for new levels of teacher accountability demanded by legislators, the state department of education joined 16 other States in implementing a new teacher evaluation system. The goal is to hold teachers account-able for student learning progress in the classroom. Under the guidance of the National Council for Teacher Quality, criteria varies by State, but in most cases, 40 percent of each teacher's accountability score would be based on the principal's evaluation and ranking based on personal observation, 30 percent would be based on personal observation by a master teacher from outside the district, and the Other 30 percent would be based on student test score gains. The state department of education would set a performance goal each school district, and the principal would set a performance goal for each teacher. In preparation, the State conducted intensive training sessions for principals and designated master teachers who would conduct the evaluations based on four class observations per teacher. Officials used standardized achievement tests to derive value-added scores that measure student learning over the year. Teacher ratings were 1-5, with I am being the lowest and 5 representing near perfection. The publication of the first year's evaluations stirred interest and controversy, particularly among teachers who worried about the possible long-term effects on job retention and tenure. Now, with the first-year evaluations in hand, the three cousins pored over their experiences. The three represented different types of school systems within the state. Jeri Lynn worked for a metropolitan system in the state capital. The system included many low-income students whose first language was nor English, and several schools within the system were teetering on the brink of State takeover if improvement in student scores didn't materialize this school year. Tish worked in a county System dominated by upper-income residents, and Joey taught in the rural community in which all three grew up. The rural community had high unemployment, and a low percentage of graduates went on to college. As a result, the cousins came to the table with differing teaching experiences. "The numbers are all over the place," Jeri Lynn remarked as she studied the pages. "The whole system is flawed, and they need to make changes," Joey said. " It's too subjective. The principal and master teacher observations are subjective because there are personal factors that affect a true outcome." "Yeah, look at the numbers from your upper-income district," Jeri Lynn said to Tish. " How can 60 percent of the teachers score 5s?" Tish chuckled. "Yeah, lucky us. Our schools are overflowing with children from wealthy families. These are the kids who will apply to Ivy League schools. I can tell you that the principals are going to avoid confrontation on all fronts. No principal is going to give any indication that their students are receiving an education that's less than perfect, and that means cramming the rankings with 5s. They claim a higher level of motivation for students, and thus the selection of an elite team of educators. So with those pressures, I don't think we get personal feedback that IS accurate." "At the other end of the spectrum, we have my rural district," Joey said. "The big problem is that the principals know everyone and have longstanding relationships with everyone in the county, so I think scores are based on personal history. We could almost predict who would get high or low scores before the observations. For principals, it can go back as far as 'his daddy and my daddy hated each other in high school, and now I get to evaluate his daughter." "I think that in many cases, principals feel pressure to align scores with state expectations. The stare expected my district to have high scores and expected rural schools such as yours to be lower," Tish said. "But isn't that partially offset by lower goals for the rural school distracts responded Joey. "The key to the accountability system is the principal in each school," Jeri Lynn suggested. "With several of the schools in Metro teetering on the edge of state takeover by the end of the year, we had lots of strict principals who wanted to hold our feet to the fire with lower scores." "I thought the whole idea was to provide the teachers With feedback so that we would know the areas where we need improvement," Tish said. "The principals were supposed to conduct two observations in the fall and two more in the spring," Jeri Lynn said. think that's asking too much of them when they already have so much on their plates. I think a lot of them are skimping on their visits. know I only had one observation last semester, and I'm sure Mr. Talley just faked the second set of numbers. The master teachers make only two observations a year, which may be more objective but counts for less." "I'm wondering, too, how a principal measure performance in a course area outside his area of expertise, such as math," Joey said. "If the guy has a phobia about math, anything the teacher says or does is going to 100k brilliant—thus a 5." Tish and Jeri Lynn looked at each other and laughed. Maybe we picked the wrong subjects," Tish said. "My question is one of perception," Jeri Lynn said. "A large percentage of my students are ELL. That affects their scores. How do you measure a 3 in my situation against a 5 for Tish? At the end of the school year, little Carlos is thrilled that his reading in English has improved, but there's no Big Bang here. a slow steady improvement that may not actually show up in big strides for a couple of years." "So, the question is how do they create a system that is fair?" Tish asked. "And accurate," added Jeri Lynn. Is a 1-5 grading System by principals and master teachers a valuable part of a feedback control system for teachers? Why?Cousins Jeri Lynn DeBose, Tish Hoover, and Josephine (Joey) Parks looked forward to meeting up during the Christmas holidays to compare notes on the results of midyear teacher evaluations. All were public school teachers in districts scattered over the state. In the pressured search for new levels of teacher accountability demanded by legislators, the state department of education joined 16 other States in implementing a new teacher evaluation system. The goal is to hold teachers account-able for student learning progress in the classroom. Under the guidance of the National Council for Teacher Quality, criteria varies by State, but in most cases, 40 percent of each teacher's accountability score would be based on the principal's evaluation and ranking based on personal observation, 30 percent would be based on personal observation by a master teacher from outside the district, and the Other 30 percent would be based on student test score gains. The state department of education would set a performance goal each school district, and the principal would set a performance goal for each teacher. In preparation, the State conducted intensive training sessions for principals and designated master teachers who would conduct the evaluations based on four class observations per teacher. Officials used standardized achievement tests to derive value-added scores that measure student learning over the year. Teacher ratings were I —5, with I am being the lowest and 5 representing near perfection. The publication of the first year's evaluations stirred interest and controversy, particularly among teachers who worried about the possible long-term effects on job retention and tenure. Now, with the first-year evaluations in hand, the three cousins pored over their experiences. The three represented different types of school systems within the state. Jeri Lynn worked for a metropolitan system in the state capital. The system included many low-income students whose first language was nor English, and several schools within the system were teetering on the brink of State takeover if improvement in student scores didn't materialize this school year. Tish worked in a county System dominated by upper-income residents, and Joey taught in the rural community in which all three grew up. The rural community had high unemployment, and a low percentage of graduates went on to college. As a result, the cousins came to the table with differing teaching experiences. "The numbers are all over the place," Jeri Lynn remarked as she studied the pages. "The whole system is flawed, and they need to make changes," Joey said. " It's too subjective. The principal and master teacher observations are subjective because there are personal factors that affect a true outcome." "Yeah, look at the numbers from your upper-income district," Jeri Lynn said to Tish. "How can 60 percent of the teachers score 5s?" Tish chuckled. "Yeah, lucky us. Our schools are overflowing with children from wealthy families. These are the kids who will apply to Ivy League schools. I can tell you that the principals are going to avoid confrontation on all fronts. No principal is going to give any indication that their students are receiving an education that's less than perfect, and that means cramming the rankings with 5s. They claim a higher level of motivation for students, and thus the selection of an elite team of educators. So with those pressures, I don't think we get personal feedback that IS accurate." "At the other end of the spectrum, we have my rural district," Joey said. "The big problem is that the principals know everyone and have longstanding relationships with everyone in the county, so I think scores are based on personal history. We could almost predict who would get high or low scores before the observations. For principals, it can go back as far as his daddy and my daddy hated each other in high school, and now I get to evaluate his daughter "I think that in many cases, principals feel pressure to align scores with state expectations. The stare expected my district to have high scores and expected rural schools such as yours to be lower," Tish said. "But isn't that partially offset by lower goals for the rural school distracts responded Joey. "The key to the accountability system is the principal in each school," Jeri Lynn suggested. "With several of the schools in Metro teetering on the edge of state takeover by the end of the year, we had lots of strict principals who wanted to hold our feet to the fire with lower scores." "l thought the whole idea was to provide the teachers With feedback so that we would know the areas where we need improvement," Tish said. "The principals were supposed to conduct two observations in the fall and two more in the spring," Jeri Lynn said. think that's asking too much of them when they already have so much on their plates. I think a lot of them are skimping on their visits. know I only had one observation last semester, and I'm sure Mr. Talley just faked the second set of numbers. The master teachers make only two observations a year, which may be more objective but counts for less." "I'm wondering, too, how a principal measure performance in a course area outside his area of expertise, such as math," Joey said. "If the guy has a phobia about math, anything the teacher says or does is going to 100k brilliant—thus a 5." Tish and Jeri Lynn looked at each other and laughed. Maybe we picked the wrong subjects," Tish said. "My question is one of perception," Jeri Lynn said. "A large percentage of my students are ELL. That affects their scores. How do you measure a 3 in my situation against a 5 for Tish? At the end of the school year, little Carlos is thrilled that his reading in English has improved, but there's no Big Bang here. a slow steady improvement that may not actually show up in big strides for a couple of years: "So, the question is how do they create a system that is fair?" Tish asked. "And accurate," added Jeri Lynn. What do you see as the major strengths and flaws in the feedback control system used in the schools in this scenario? What changes do you recommend to overcome the flaws?The Pew Research Center Internet Project conducted a survey of 857 Internet users. This survey provided a variety of statistics on them. If required, round your answers to four decimal places. (a) The sample survey showed that 90% of respondents said the Internet has been a good thing for them personally. Develop a 95% confidence interval for the proportion of respondents who say the Internet has been a good thing for them personally. to (b) The sample survey showed that 67% of Internet users said the Internet has generally strengthened their relationship with family and friends. Develop a 95% confidence interval for the proportion of respondents who say the Internet has strengthened their relationship with family and friends. to (c) Fifty-six percent of Internet users have seen an online group come together to help a person or community solve a problem, whereas only 25% have left an online group because of unpleasant interaction. Develop a 95%…
- the Fleming article discusses the role of epidemiology in healthcare management decision-making. The author states that "I consider it virtually impossible to develop a comprehensive strategic plan without incorporating estimates of the prevalence of the disease." Is this true? Why or why not...explain your answer. Offer an example of a real organizational issue when a manager needs supportive evidence to be successful in a specific function (list the function of management). Offer an explanation of all types of evidence you, as that manager, would need to make good decisions.1) What is your opinion? "Forget it! We are not going to train our employees in first aid. Emergencies notwithstanding. I don't want a bunch of amateur doctors running around the company doing more harm than goo." Mary Vo Dinh, safety director for Gulf Coast Manufacturing, was getting nowhere trying to convince her boss that the company should have employees trained in first aid in the event of an emergency. "But John, we have had three hurricanes in just two years. Tornadoes are not uncommon here on the coast." I will repeat myself just one more time," said her boss, "No first-aid training." Who is right in this case? 2) What is your opinion? The city council members are in a real quandary about the request from International Plastics Corporation (IPC) to open a new plant on a 100 acre plot owned by the city. On one hand, the city needs the new jobs that the IPC plan would bring - badly. High unemployment is the city's mst serious problem, and every member of the city council ran on…In a recent case study focused on planning management, a multinational manufacturing company sought to enhance its production efficiency and resource allocation. The organization faced challenges in coordinating activities across various departments and struggled to meet deadlines consistently. The company implemented a comprehensive planning management system that incorporated advanced scheduling algorithms and real-time tracking mechanisms. This initiative aimed to streamline workflows, optimize resource utilization, and minimize production bottlenecks. As a result, the company experienced a significant improvement in overall operational efficiency, reduced lead times, and increased customer satisfaction. The successful implementation of this planning management strategy highlighted the importance of aligning organizational goals with a well-defined planning framework. Question: How did the implementation of the planning management system impact the collaboration and communication…
- subject : quality control topic: six sigma The increased global manufacturing competition forces many organizations to adapt quality tools and techniques in order to survive in the modern marketplace. Find and choose a real case study of the organization of your own choice (such as healthcare, IT-industry, automobile, chemical etc.) and critically analyzed how these organization reduced their product defects and reduced cost using six sigma methodology.Analysis of customer complaints at an e-commerce retailer revealed the following: Billing errors: 1,531 Shipping errors: 940 Electronic charge errors: 691 Shipping delays: 2,989 Packing errors: 1,758 The data has been sorted for your convenience. Calculate the percent of total complaints for each category of errors. Round your answers to two decimal places. Name Amount Percent of Total Shipping delays 2,989 % Packing errors 1,758 % Billing errors 1,531 % Shipping errors 940 % Electronic charge errors 691 % Use the Excel Pareto template to construct a Pareto chart and choose the correct Pareto diagram. The correct Pareto diagram is ___. __________________ account for the majority of customer complaints. If two of these root causes are fixed, ____________ of customer complaints will be solved.please help with this question using the sensitivity report and explain how you got the answer
- Background: Data about the frequency of adverse events related to inappropriate care in hospitals come from studies of medical records as if they represented a true record of adverse events. In a prospective, observational design we analyzed discussion of adverse events during the care of all patients admitted to three units of a large, urban teaching hospital affiliated to a university medical school. Discussion took place during routine clinical meetings. We undertook the study to enhance understanding of the incidence and scope of adverse events as a basis for preventing themMethods: Ethnographers trained in qualitative observational research attended dayshift, weekday, regularly scheduled attending rounds, residents' work rounds, nursing shift changes, case conferences, and other scheduled meetings in three study units as well as various departmental and section meetings. They recorded all adverse events during patient care discussed at these meetings and developed a classification…You may need to use the appropriate appendix table or technology to answer this question. The following results come from two independent random samples taken of two populations. Sample 1 Sample 2 n1 = 60 n2 = 25 x1 = 13.6 x2 = 11.6 σ1 = 2.5 σ2 = 3 (a) What is the point estimate of the difference between the two population means? (Use x1 − x2.) (b) Provide a 90% confidence interval for the difference between the two population means. (Use x1 − x2. Round your answers to two decimal places.) to (c) Provide a 95% confidence interval for the difference between the two population means. (Use x1 − x2. Round your answers to two decimal places.) toThe widths of 79 randomly selected window blinds were found to have a standard deviation of 2.37. Construct the 95% confidence interval for the population standard deviation of the widths of all window blinds in this factory. Round your answers to two decimal places. Lower endpoint: Upper endpoint: