The National Highvay Traffic Safety Administration reported the percentage of traffic accidents occumring each day of the week. Assume that a sample of 420 accidents provided the following data. Sunday Monday Tuesday Wednesday Thursday Friday Saturday 50 66 53 48 55 69 79 (0) Conduct a hypothesis test to determine if the proportion of traffic accidents is the same for each day of the week. Use a 0.05 level of significance. State the null and alternative hypotheses. O H,: Psun - Pran PWed "Prhu H: Not all proportions are equal. O H,: Not all proportions are equal. H: Psun " Pron " Prue " Pwed " Prhu " Prn Psat"7 O H,: Not all proportions are equal. Hi Psun * Pton * Prue * Pwed * Prnu * Pen* Pat O H,i Pun * Proen Prue " Pwed * Pthu H: All proportions are equal. Find the value of the test statistic. (Round your ansver to three decimal places.) Find the prvalue. (Round your answer to four decimal places.) prvalue = State your conclusion. O Reject H. We conclude that the proportion of traffic accidents is the same for each day of the week. O Do not reject H,. We conclude that the proportion of traffic accidents is the same for each day of the week. O Raject H. We conclude that the proportion of traffic accidents is not the same for each day of the vweek. O Do not reject H. We conclude that the proportion of traffic accidents is not the same for each day of the week. (b) Compute the percentage of traffic accidents occurring on each day of the week. (Round your answers to two decimal places.) Sunday Monday Tuesday Wednesday Thursday Friday Saturday What day has the highest percentage of traffic accidents? O unday O Monday O Tuesday O Wednesday O Thursday O Friday O Saturday
The National Highvay Traffic Safety Administration reported the percentage of traffic accidents occumring each day of the week. Assume that a sample of 420 accidents provided the following data. Sunday Monday Tuesday Wednesday Thursday Friday Saturday 50 66 53 48 55 69 79 (0) Conduct a hypothesis test to determine if the proportion of traffic accidents is the same for each day of the week. Use a 0.05 level of significance. State the null and alternative hypotheses. O H,: Psun - Pran PWed "Prhu H: Not all proportions are equal. O H,: Not all proportions are equal. H: Psun " Pron " Prue " Pwed " Prhu " Prn Psat"7 O H,: Not all proportions are equal. Hi Psun * Pton * Prue * Pwed * Prnu * Pen* Pat O H,i Pun * Proen Prue " Pwed * Pthu H: All proportions are equal. Find the value of the test statistic. (Round your ansver to three decimal places.) Find the prvalue. (Round your answer to four decimal places.) prvalue = State your conclusion. O Reject H. We conclude that the proportion of traffic accidents is the same for each day of the week. O Do not reject H,. We conclude that the proportion of traffic accidents is the same for each day of the week. O Raject H. We conclude that the proportion of traffic accidents is not the same for each day of the vweek. O Do not reject H. We conclude that the proportion of traffic accidents is not the same for each day of the week. (b) Compute the percentage of traffic accidents occurring on each day of the week. (Round your answers to two decimal places.) Sunday Monday Tuesday Wednesday Thursday Friday Saturday What day has the highest percentage of traffic accidents? O unday O Monday O Tuesday O Wednesday O Thursday O Friday O Saturday

MATLAB: An Introduction with Applications
6th Edition
ISBN:9781119256830
Author:Amos Gilat
Publisher:Amos Gilat
Chapter1: Starting With Matlab
Section: Chapter Questions
Problem 1P

Related questions
Topic Video
Question
100%
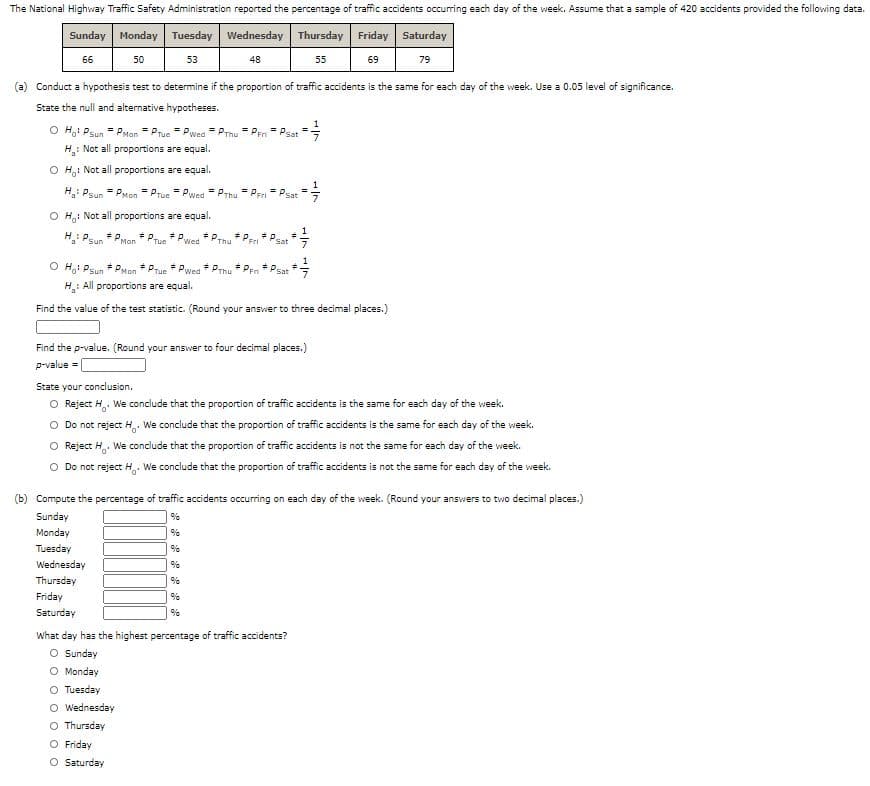
Transcribed Image Text:The National Highway Traffic Safety Administration reported the percentage of traffic accidents occuring each day of the week. Assume that a sample of 420 accidents provided the following data.
Saturday
Sunday Monday Tuesday Wednesday Thursday Friday
53
48
55
69
79
66
50
(a) Conduct a hypothesis test to determine if the proportion of traffic accidents is the same for each day of the week. Use a 0.05 level of significance.
State the null and alternative hypotheses.
= Pwed
= p.
Sat
= Pen
O H: Psun
Not all proportions are equal.
- PMan P
Tue
Thu
H
O H,: Not all proportions are equal.
= Pwed
s Psat7
1
%3D
H: Psun PMon Prue
Prhu
s Peri
O H,: Not all proportions are equal.
%3D
H: Psun * PMon* Prue
Wed
PThu
Sat
O H,: Psun * PMon * Prue * Pwed
* Prhu * Pr
Fri
Sat
H: All proportions are equal.
Find the value of the test statistic. (Round your answer to three decimal places.)
Find the p-value. (Round your answer to four decimal places.)
p-value =
State your conclusion.
O Reject H. We conclude that the proportion of traffic accidents is the same for each day of the week.
O Do not reject H, We conclude that the proportion of traffic accidents is the same for each day of the week.
O Reject H. We conclude that the proportion of traffic accidents is not the same for each day of the week.
O Do not reject H. We conclude that the proportion of traffic accidents is not the same for each day of the week.
(b) Compute the percentage of traffic accidents occurring on each day of the week. (Round your answers to two decimal places.)
Sunday
Monday
Tuesday
Wednesday
Thursday
Friday
Saturday
What day has the highest percentage of traffic accidents?
O Sunday
O Monday
O Tuesday
O Wednesday
O Thursday
O Friday
O Saturday
Expert Solution
Step 1
Introduction:
Denote pSun, pMon, pTue, pWed, pThu, pFri, and pSat as the true proportions of traffic accidents on the seven days of the week, respectively.

Trending now
This is a popular solution!

Step by step
Solved in 3 steps with 5 images

Knowledge Booster


Learn more about
Need a deep-dive on the concept behind this application? Look no further. Learn more about this topic, statistics and related others by exploring similar questions and additional content below.Recommended textbooks for you
MATLAB: An Introduction with Applications
Statistics
ISBN:
9781119256830
Author:
Amos Gilat
Publisher:
John Wiley & Sons Inc

Probability and Statistics for Engineering and th…
Statistics
ISBN:
9781305251809
Author:
Jay L. Devore
Publisher:
Cengage Learning

Statistics for The Behavioral Sciences (MindTap C…
Statistics
ISBN:
9781305504912
Author:
Frederick J Gravetter, Larry B. Wallnau
Publisher:
Cengage Learning
MATLAB: An Introduction with Applications
Statistics
ISBN:
9781119256830
Author:
Amos Gilat
Publisher:
John Wiley & Sons Inc
Probability and Statistics for Engineering and th…
Statistics
ISBN:
9781305251809
Author:
Jay L. Devore
Publisher:
Cengage Learning
Statistics for The Behavioral Sciences (MindTap C…
Statistics
ISBN:
9781305504912
Author:
Frederick J Gravetter, Larry B. Wallnau
Publisher:
Cengage Learning

Elementary Statistics: Picturing the World (7th E…
Statistics
ISBN:
9780134683416
Author:
Ron Larson, Betsy Farber
Publisher:
PEARSON

The Basic Practice of Statistics
Statistics
ISBN:
9781319042578
Author:
David S. Moore, William I. Notz, Michael A. Fligner
Publisher:
W. H. Freeman

Introduction to the Practice of Statistics
Statistics
ISBN:
9781319013387
Author:
David S. Moore, George P. McCabe, Bruce A. Craig
Publisher:
W. H. Freeman