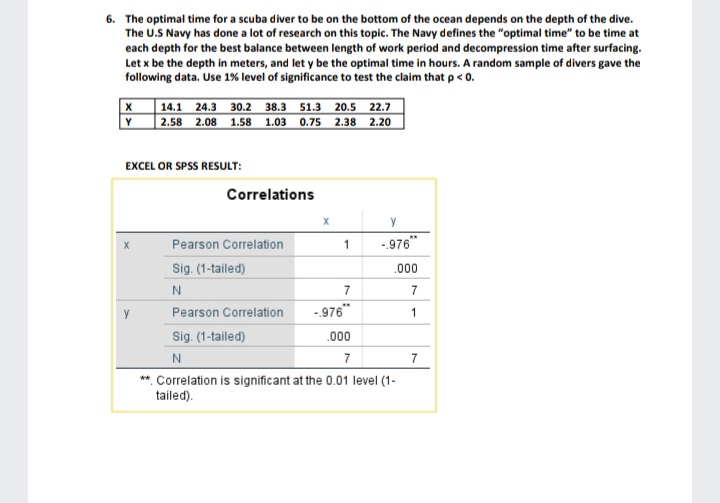
The optimal time for a scuba diver to be on the bottom of the ocean depends on the depth of the dive. The U.S Navy has done a lot of research on this topic. The Navy defines the "optimal time" to be time at each depth for the best balance between length of work period and decompression time after surfacing. Let x be the depth in meters, and let y be the optimal time in hours. A random sample of divers gave the following data. Use 1% level of significance to test the claim that p< 0.
The optimal time for a scuba diver to be on the bottom of the ocean depends on the depth of the dive. The U.S Navy has done a lot of research on this topic. The Navy defines the "optimal time" to be time at each depth for the best balance between length of work period and decompression time after surfacing. Let x be the depth in meters, and let y be the optimal time in hours. A random sample of divers gave the following data. Use 1% level of significance to test the claim that p< 0.

Linear Algebra: A Modern Introduction
4th Edition
ISBN:9781285463247
Author:David Poole
Publisher:David Poole
Chapter2: Systems Of Linear Equations
Section2.4: Applications
Problem 2EQ: 2. Suppose that in Example 2.27, 400 units of food A, 500 units of B, and 600 units of C are placed...

Related questions
Question
Transcribed Image Text:6. The optimal time for a scuba diver to be on the bottom of the ocean depends on the depth of the dive.
The U.S Navy has done a lot of research on this topic. The Navy defines the "optimal time" to be time at
each depth for the best balance between length of work period and decompression time after surfacing.
Let x be the depth in meters, and let y be the optimal time in hours. A random sample of divers gave the
following data. Use 1% level of significance to test the claim that p< 0.
X 14.1 24.3 30.2 38.3 51.3 20.5 22.7
| 2.58 2.08 1.58 1.03 0.75 2.38 2.20
EXCEL OR SPSS RESULT:
Correlations
Pearson Correlation
-.976"
1
Sig. (1-tailed)
.000
N
7
7
Pearson Correlation
-976"
1
Sig. (1-tailed)
.000
N
7
7
**. Correlation is significant at the 0.01 level (1-
tailed).
Expert Solution
This question has been solved!
Explore an expertly crafted, step-by-step solution for a thorough understanding of key concepts.

Step by step
Solved in 2 steps

Recommended textbooks for you
Linear Algebra: A Modern Introduction
Algebra
ISBN:
9781285463247
Author:
David Poole
Publisher:
Cengage Learning

Algebra & Trigonometry with Analytic Geometry
Algebra
ISBN:
9781133382119
Author:
Swokowski
Publisher:
Cengage
Linear Algebra: A Modern Introduction
Algebra
ISBN:
9781285463247
Author:
David Poole
Publisher:
Cengage Learning
Algebra & Trigonometry with Analytic Geometry
Algebra
ISBN:
9781133382119
Author:
Swokowski
Publisher:
Cengage