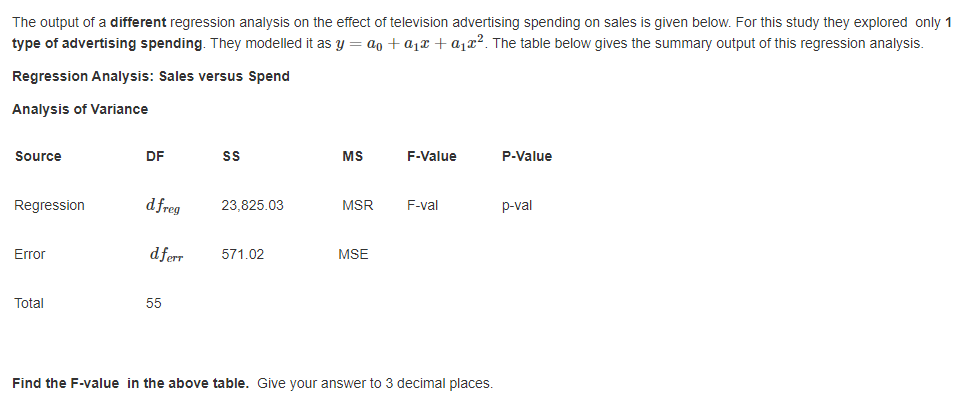
The output of a different regression analysis on the effect of television advertising spending on sales is given below. For this study they explored only 1 type of advertising spending. They modelled it as y = ao +a,r +a1x². The table below gives the summary output of this regression analysis. Regression Analysis: Sales versus Spend Analysis of Variance Source DF MS F-Value P-Value Regression dfreg 23,825.03 MSR F-val p-val Error dferr 571.02 MSE Total 55 Find the F-value in the above table. Give your answer to 3 decimal places.


Q: A county real estate appraiser wants to develop a statistical model to predict the appraised value…
A: Solution: Let X be the number of rooms and Y be the appraised value of the house. From the given…
Q: A number of investigations have focused on the problem of assessing loads that can be manually…
A: Given, y = 30+0.90x1+0.08x2-4.50x3+e y = individual's rating of acceptable load (kg)x1 = extent of…
Q: A professor at the University of Alabama was interested in evaluating the relationship between…
A: From the output, The regression equation is, Delinquency=-0.418Family support score+3.628
Q: What is the predicted value for delinquency for a family with a family support score of 546? Using…
A: 1. What is the predicted value for delinquency for a family with a family support score of 546? The…
Q: a) Write out the regression equation. b) Fill in the missing values *, **, *** and ****. c) Use the…
A: The study is about the relationship between the prices of houses, how many bedrooms, House size in…
Q: Critics of television often refer to the detrimental effects that all the violence shown on…
A: Solution: From the given information, the regression equation is
Q: In analyzing the effects of an after-school reading program, you run a regression analysis with…
A: From output we see that p value corresponding to Program Participation is 0.000606411 which is very…
Q: A ski resort asked a random sample of guests to rate their satisfaction on various attributes of…
A: Note: Hey, since multiple subparts are posted, we will answer first three subparts according to our…
Q: The output of a different regression analysis on the effect of radio advertising spending,…
A: The formula for the error degrees of freedom is,
Q: The following multiple regression printout can be used to predict a person's height (in inches)…
A:
Q: A car dealership would like to develop a regression model that would predict the number of cars sold…
A: We can find p-value from F table as we know that test Statistic for ANOVA test is F= 7.04 with 1…
Q: A company that manufactures computer chips wants to use a multiple regression model to study the…
A: MSR = 98 SSE = 32 k = 5 N = 172
Q: A car dealership would like to develop a regression model that would predict the number of cars sold…
A: Here
Q: According to the nutrition research, recommendation on the consumption of fiber for children and…
A:
Q: In the table below ratings data on x = the quality of the speed of execution and y = overall…
A: In this case, the speed of execution (x) is the independent variable and overall satisfaction rating…
Q: What is the value for the intercept? For every-one unit change in family support, what is the…
A: Regression analysis
Q: The commercial division of a real estate firm is conducting a regression analysis of the…
A: Solution: Given information: n= 9 observation k= 1 independent variable Sum of square of…
Q: In baseball, two statistics, the ERA (Earned Run Average) and the WHIP (Walks and Hits per Inning…
A: Solution: Let ERA be the dependent variable and WHIP be the independent variable. The coefficient of…
Q: Solve the attachment.
A: Since you have posted a question with multiple sub-parts, we will solve first three sub-parts for…
Q: A runner was tested on a treadmill. During the test, his speed x (in km/h) and his heart rate y were…
A: Given data: y 122 132 143 160 174 189 x 9 11 13 15 17 19
Q: The commercial division of a real estate firm is conducting a regression analysis of the…
A: Hello! As you have posted more than 3 sub parts, we are answering the first 3 sub-parts. In case…
Q: The following regression model was estimated. Q is the number of meals served, P is the average…
A: (A). coefficient of determination: From the given regression output, the coefficient of…
Q: 13. What proportion of the variance in Course % is attributable to the regression model? A- .568…
A: 13) The proportion of variance in course is attributable to the regression model is R-square.
Q: A health analyst studied the relationship between blood pressure and independent variables age…
A: Given Information: The dependent variable is Blood pressure. The independent variables are age,…
Q: A car dealership would like to develop a regression model that would predict the number of cars sold…
A: Solution: Let X be the number of years of sales experience and Y be the number of cars sold per…
Q: The following multiple regression printout can be used to predict a person's height (in inches)…
A: (a) Obtain the value of the test statistic for the shoe size. The value of the test statistic for…
Q: A real estate research firm has developed a regression model relating list price (Y in $1,000) with…
A: Hello. Since your question has multiple sub-parts, we will solve first three sub-parts for you. If…
Q: A professor at the University of Alabama was interested in evaluating the relationship between…
A: Given information: The output of simple linear regression model is given.
Q: A car dealership would like to develop a regression model that would predict the number of cars sold…
A: Here, it is needed to test whether the model is useful for predicting average monthly sales for…
Q: A professor at the University of Alabama was interested in evaluating the relationship between…
A: Given information: The output of simple linear regression model is given.
Q: The following multiple regression printout can be used to predict a person's height (in inches)…
A: (a) Obtain the value of the test statistic for shoe size. The value of the test statistic for shoe…
Q: A regression model to predict Y, the state burglary rate per 100,000 people, used the following four…
A: a) The number of independent variables is 4. The sample size n is 45. The degrees of freedom is…
Q: What is the population? What is the dependent variable? What is the…
A: The given statement is- A professor at the University of Alabama was interested in evaluating the…
Q: Plz look at the photo atta
A:
Q: Now, the predictors flyer and display were added to the dataset and a multiple linear regression…
A: Given:
Q: The commercial division of a real estate firm is conducting a regression analysis of the…
A: Given data The regression equation is Y=20.2+7.25X Predictor Coef SE Coef…
Q: According to the nutrition research, recommendation on the consumption of fiber for children and…
A: (b) EXCEL procedure: Go to EXCEL Go to Data>Data Analysis. Choose Regression. Input Y range…
Q: The following regression model was estimated. Q is the number of meals served, P is the average…
A: Hello! As you have posted more than 3 sub parts, we are answering the first 3 sub-parts. In case…
Q: The commercial division of a real estate firm is conducting a regression analysis of the…
A: From the given information, The regression line is given as: Y=20.2+7.25X.
Q: The output of a different regression analysis on the effect of radio advertising spending,…
A: The regression model is y = a0 + a1x1 + a2x2 + a3x3.
Q: In the table below ratings data on x = the quality of the speed of execution and y = overall…
A: Excel: Data --> Data analysis -->Regression
Q: A highway employee performed a regression analysis of the relationship between the number of…
A: The answer can be given by given Data and formulas for s and R.
Q: Use the following data in any software like Excel or Eviews and develop a regression model using the…
A: Regression Model : Regression analysis is used to measures the association or linear relationship…
Q: The following regression model was estimated. Q is the number of meals served, P is the average…
A: Hello. Since your question has multiple sub-parts, we will solve first three sub-parts for you. If…
Q: In baseball, two statistics, the ERA (Earned Run Average) and the WHIP (Walks and Hits per Inning…
A: Interpret the slope. The correct option is identified below: From the information given that The…
Q: he following table shows the starting salary and profile of a sample of 10 employees in a certain…
A: Solution: n= 10 observation k= 3 independent variables. The MS Excel output from data analysis tab…
Q: The commercial division of a real estate firm is conducting a regression analysis of the…
A:
Q: he commercial division of a real estate firm is conducting a regression analysis of the relationship…
A: Solution: a) The degree of freedom associated with total is n-1=8 n=1+8=9 9 apartment buildings were…
Q: Construct a 95% confidence interval around the sample slope and interpret its meaning. The…
A: to find the 95% confidence interval for the slope
Q: A company sells copiers and performs preventative maintenance and repair services. The manager wants…
A:

Step by step
Solved in 2 steps

- Find the equation of the regression line for the following data set. x 1 2 3 y 0 3 4Suppose that a kitchen cabinet warehouse company would like to be able to predict the area of a customer’s kitchen using the number of cabinets and the kitchen ceiling height. To do so data is collected on the following variables from a random sample of customers: Area – area of the kitchen in square feet Height – ceiling height in the kitchen (from floor to ceiling) in inches Cabinets – number of cabinets in the kitchen Suppose that a multiple linear regression model was fit to the data and that the following output resulted: Coefficients: (Intercept)HeightCabinets Estimate-57.98771.2760.3393 Std. Error8.63820.26430.1302 t value -6.7134.8282.607 Pr(>|t|)2.75e-074.44e-050.0145 What is the predicted area of a kitchen with a height of 96 inches and 10 cabinets? Report your answer to 1 decimal place. square feetSuppose that a kitchen cabinet warehouse company would like to be able to predict the area of a customer’s kitchen using the number of cabinets and the kitchen ceiling height. To do so data is collected on the following variables from a random sample of customers: Area – area of the kitchen in square feet Height – ceiling height in the kitchen (from floor to ceiling) in inches Cabinets – number of cabinets in the kitchen Suppose that a multiple linear regression model was fit to the data and that the following output resulted: Coefficients: (Intercept)HeightCabinets Estimate-57.98771.2760.3393 Std. Error8.63820.26430.1302 t value -6.7134.8282.607 Pr(>|t|)2.75e-074.44e-050.0145 10 Question 10 This is not a form; we suggest that you use the browse mode and read all parts of the question carefully. Which of the following is the correct interpretation of the coefficient for Cabinets? For a kitchen with a given ceiling height, the average number of cabinets…
- Suppose that a kitchen cabinet warehouse company would like to be able to predict the area of a customer’s kitchen using the number of cabinets and the kitchen ceiling height. To do so data is collected on the following variables from a random sample of customers: Area – area of the kitchen in square feet Height – ceiling height in the kitchen (from floor to ceiling) in inches Cabinets – number of cabinets in the kitchen Suppose that a multiple linear regression model was fit to the data and that the following output resulted: Coefficients: (Intercept)HeightCabinets Estimate-57.98771.2760.3393 Std. Error8.63820.26430.1302 t value -6.7134.8282.607 Pr(>|t|)2.75e-074.44e-050.0145 Why is the interpretation of the constant term (i.e. "intercept") not meaningful for this example? The predicted area will be negative when the number of cabinets is zero and the height of the kitchen is also zero. But we cannot have a negative area, nor a kitchen ceiling height of 0 inches.…A newspaper used an estimated regression equation to describe the relationship between y = error percentage for subjects reading a four-digit liquid crystal display and the independent variables x1 = level of backlight, x2 = character subtense, x3 = viewing angle, and x4 = level of ambient light. From a table given in the article, SSRegr = 21.6, SSResid = 22, and n = 30. What is the value of the test statistic F What is the P-value What is r2 What is SeThe Wall Street Journal asked Concur Technologies, Inc., an expense management company, to examine data from 8.3 million expense reports to provide insights regarding business travel expenses. Their analysis of the data showed that New York was the most expensive city. The following table shows the average daily hotel room rate (X) and the average amount spent on entertainment (Y) for a random sample of 9 of the 25 most-visited U.S. cities. These data lead to the estimated regression equation y = 17.49 + 1.0334x. For these data SSE = 1541.4. Use Table 1 of Appendix B. a. Predict the amount spent on entertainment for a particular city that has a daily room rate of $89 (to 2 decimals). b. Develop a 95% confidence interval for the mean amount spent on entertainment for all cities that have a daily room rate of $89 (to 2 decimals). c. The average room rate in Chicago is $128. Develop a 95% prediction interval for the amount spent on entertainment in Chicago (to 2 decimals).
- The Wall Street Journal asked Concur Technologies, Inc., an expense management company, to examine data from 8.3 million expense reports to provide insights regarding business travel expenses. Their analysis of the data showed that New York was the most expensive city. The following table shows the average daily hotel room rate (X) and the average amount spent on entertainment (Y) for a random sample of 9 of the 25 most-visited U.S. cities. These data lead to the estimated regression equation y = 17.49 + 1.0334x. For these data SSE = 1541.4. Use Table 1 of Appendix B. (NEED ANSWER FOR A) a. Predict the amount spent on entertainment for a particular city that has a daily room rate of $89 (to 2 decimals).A study is conducted to determine if there is a relationship between the two variables, blood haemoglobin (Hb) levels and packed cell volumes (PCV) in the female population. A simple linear regression analysis was performed using SPSS. Based on the SPSS output of the ANOVA table, which of the following statements is the CORRECT interpretation? 1. The regression model statistically significantly predicts the blood haemoglobin level. 2. About 39.98 % of variance in Hb is explained by PCV. 3. The regression model does not fit the data. 4. There is significant contribution of Hb towards PCV.The new manager of an Information Technology company collected data for a sample of 20 computer programmers in the organization to perform a multiple regression analysis on the structure of their salaries. The aim of this manager in this exercise is to determine if the Salary (y) of a hired computer programmer was related to the years of Experience (??) in the organization and also the Score (??) of the programmers during their first interview aptitude test scores. The years of experience, score on the aptitude test and the corresponding annual salary (in thousands of Ghana cedis) for a sample of the 20 programmers is shown in the Regression statistics table below; Experience (??) (in years) Score (??) (out of 100%) Salary (y) (GH¢ 000) 4 78 24 7 100 43 1 86 23.7 5 82 34.3 8 86 35.8 10 84 38 0 75 22.2 1 80 23.1 6 83 30 6 91 33 9 88 38 2 73 26.6 10 75 36.2 5 81 31.6…
- The new manager of an Information Technology company collected data for a sample of 20 computer programmers in the organization to perform a multiple regression analysis on the structure of their salaries. The aim of this manager in this exercise is to determine if the Salary (y) of a hired computer programmer was related to the years of Experience (??) in the organization and also the Score (??) of the programmers during their first interview aptitude test scores. The years of experience, score on the aptitude test and the corresponding annual salary (in thousands of Ghana cedis) for a sample of the 20 programmers is shown in the Regression statistics table below; Experience (??) (in years) Score (??) (out of 100%) Salary (y) (GH¢ 000) 4 78 24 7 100 43 1 86 23.7 5 82 34.3 8 86 35.8 10 84 38 0 75 22.2 1 80 23.1 6 83 30 6 91 33 9 88 38 2 73 26.6 10 75 36.2 5 81 31.6…A manufacturing company that produces laminate for countertops is interested in studying the relationship between the number of hours of training that an employee receives and the number of defects per countertop produced. Ten employees are randomly selected. The number of hours of training each employee has received is recorded and the number of defects on the most recent countertop produced is determined. The results are as follows. Hours of Training Defects per Countertop1 54 17 03 32 52 45 15 21 86 2 The estimated regression equation and the standard error are given. Defects per Countertop=6.717822−1.004950(Hours of Training)Se=1.229787 Suppose a new employee has had 1 hour of training. What would be the 90% prediction interval for the number of defects per countertop? Round your answer to two decimal places.A manufacturing company that produces laminate for countertops is interested in studying the relationship between the number of hours of training that an employee receives and the number of defects per countertop produced. Ten employees are randomly selected. The number of hours of training each employee has received is recorded and the number of defects on the most recent countertop produced is determined. The results are as follows. Hours of Training Defects per Countertop1 54 17 03 32 52 45 15 21 86 2 The estimated regression equation and the standard error are given. Defects per Countertop=6.717822−1.004950(Hours of Training)Se=1.229787S Suppose a new employee has had 3 hours of training. What would be the 95 prediction interval for the number of defects per countertop? Round your answer to two decimal places.
