The population (in millions) and the violent crime rate (per 1000) were recorded for 10 metropolltan areas. The data are shown In the following table. Do these data provide evidence to reject the null hypothesis that p = 0 in favor of p # 0 at a = .05? (Give your answers correct to three decimal places.) Population 9.2 2.6 1.3 6.6 0.4 0.2 2.3 4.3 3.3 0.2 Crime Rate 11.9 9.1 7 8.7 8.1 8.1 9.5 8.5 9 6.7 (a) Calculate r. 79 (II) Calculate the critical region. x (smaller value) x ( larger value) -2.262 2.262 (b) State the appropriate conclusion. O Reject the null hypothesis, there is not significant evidence that p # 0. O Reject the null hypothesis, there is significant evidence that p # 0. O Fall to reject the null hypothesis, there is not significant evidence that p 0. O Fall to reject the null hypothesis, there is significant evidence that p # 0.
The population (in millions) and the violent crime rate (per 1000) were recorded for 10 metropolltan areas. The data are shown In the following table. Do these data provide evidence to reject the null hypothesis that p = 0 in favor of p # 0 at a = .05? (Give your answers correct to three decimal places.) Population 9.2 2.6 1.3 6.6 0.4 0.2 2.3 4.3 3.3 0.2 Crime Rate 11.9 9.1 7 8.7 8.1 8.1 9.5 8.5 9 6.7 (a) Calculate r. 79 (II) Calculate the critical region. x (smaller value) x ( larger value) -2.262 2.262 (b) State the appropriate conclusion. O Reject the null hypothesis, there is not significant evidence that p # 0. O Reject the null hypothesis, there is significant evidence that p # 0. O Fall to reject the null hypothesis, there is not significant evidence that p 0. O Fall to reject the null hypothesis, there is significant evidence that p # 0.

Algebra & Trigonometry with Analytic Geometry
13th Edition
ISBN:9781133382119
Author:Swokowski
Publisher:Swokowski
Chapter5: Inverse, Exponential, And Logarithmic Functions
Section5.6: Exponential And Logarithmic Equations
Problem 70E

Related questions
Question
100%
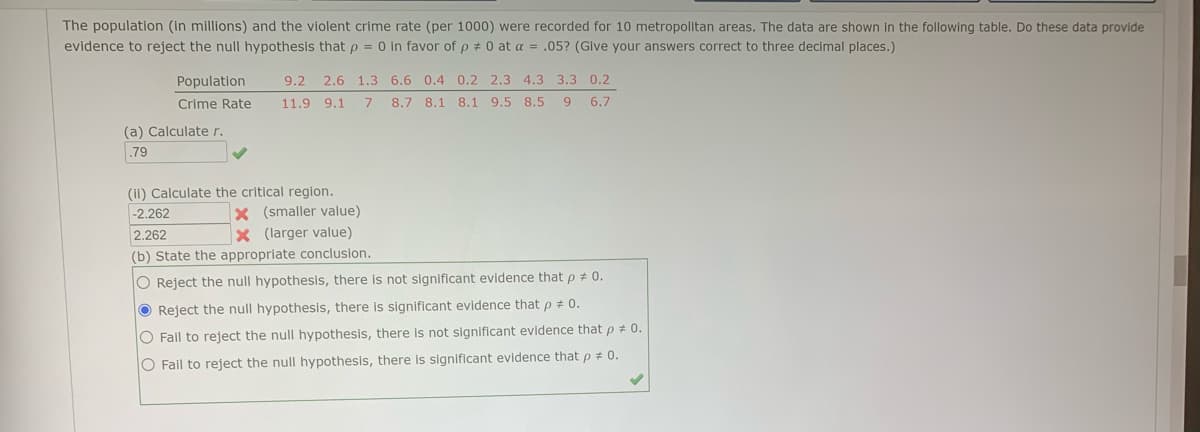
Transcribed Image Text:The population (in millions) and the violent crime rate (per 1000) were recorded for 10 metropolitan areas. The data are shown in the following table. Do these data provide
evidence to reject the null hypothesis that p = 0 in favor of p + 0 at a = .05? (Give your answers correct to three decimal places.)
Population
9.2 2.6 1.3 6.6 0.4 0.2 2.3 4.3 3.3 0.2
Crime Rate
11.9 9.1
7 8.7 8.1 8.1 9.5 8.5
6.7
(a) Calculate r.
79
(ii) Calculate the critical region.
X (smaller value)
X (larger value)
-2.262
2.262
(b) State the appropriate conclusion.
O Reject the null hypothesis, there is not significant evidence that p # 0.
O Reject the null hypothesis, there Is significant evidence that p # 0.
O Fail to reject the null hypothesis, there is not significant evidence that p + 0.
O Fail to reject the null hypothesis, there is significant evidence that p # 0.
Expert Solution
This question has been solved!
Explore an expertly crafted, step-by-step solution for a thorough understanding of key concepts.

Step by step
Solved in 2 steps with 1 images

Knowledge Booster


Learn more about
Need a deep-dive on the concept behind this application? Look no further. Learn more about this topic, statistics and related others by exploring similar questions and additional content below.Recommended textbooks for you
Algebra & Trigonometry with Analytic Geometry
Algebra
ISBN:
9781133382119
Author:
Swokowski
Publisher:
Cengage

Glencoe Algebra 1, Student Edition, 9780079039897…
Algebra
ISBN:
9780079039897
Author:
Carter
Publisher:
McGraw Hill
Algebra & Trigonometry with Analytic Geometry
Algebra
ISBN:
9781133382119
Author:
Swokowski
Publisher:
Cengage
Glencoe Algebra 1, Student Edition, 9780079039897…
Algebra
ISBN:
9780079039897
Author:
Carter
Publisher:
McGraw Hill