The price X (dollars per pound) and consumption y (in pounds per capita) of beef were samples for 10 randomly selected years. The following data should be used to answer the question that follows. n = 10 Ex = 36.19 Ex2 = 134.17 2.9 < x S 6.2 Ey = 36.19774.74 Ey2 = 60739.23 Exy = 2832.21 %| Before the standard error of regression, se , can be calculated, it is necessary to calculate SSyy. Enter the value for SSyy accurate to the nearest tenth.
The price X (dollars per pound) and consumption y (in pounds per capita) of beef were samples for 10 randomly selected years. The following data should be used to answer the question that follows. n = 10 Ex = 36.19 Ex2 = 134.17 2.9 < x S 6.2 Ey = 36.19774.74 Ey2 = 60739.23 Exy = 2832.21 %| Before the standard error of regression, se , can be calculated, it is necessary to calculate SSyy. Enter the value for SSyy accurate to the nearest tenth.

Glencoe Algebra 1, Student Edition, 9780079039897, 0079039898, 2018
18th Edition
ISBN:9780079039897
Author:Carter
Publisher:Carter
Chapter4: Equations Of Linear Functions
Section4.6: Regression And Median-fit Lines
Problem 4GP

Related questions
Question
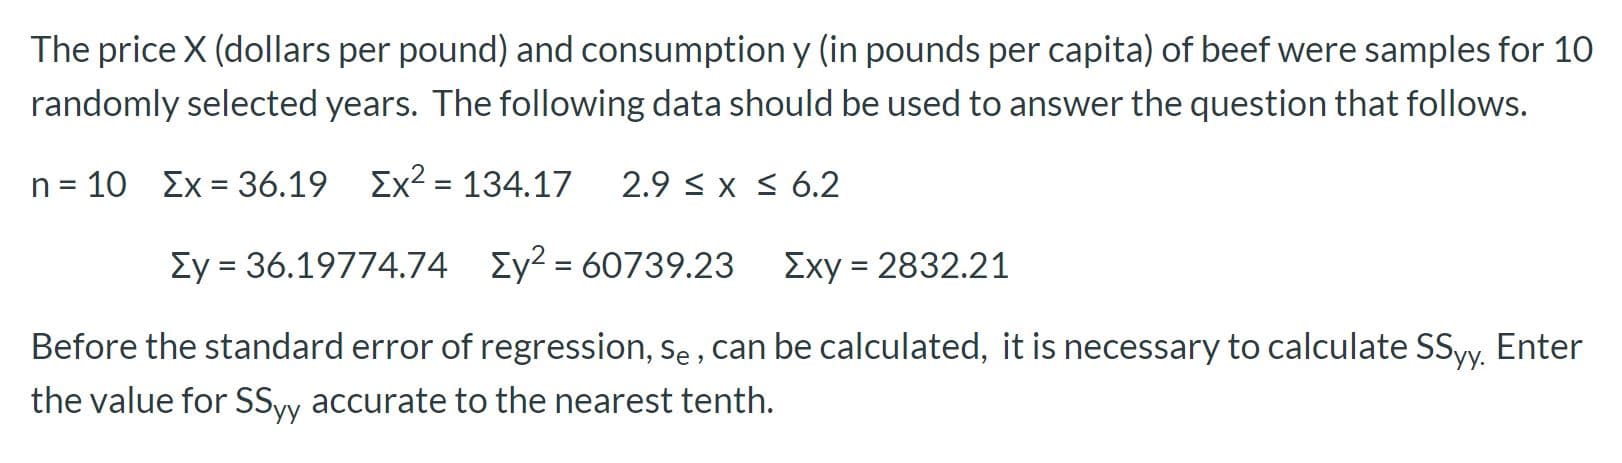
Transcribed Image Text:The price X (dollars per pound) and consumption y (in pounds per capita) of beef were samples for 10
randomly selected years. The following data should be used to answer the question that follows.
n = 10 Ex = 36.19 Ex2 = 134.17
2.9 < x S 6.2
Ey = 36.19774.74 Ey2 = 60739.23
Exy = 2832.21
%|
Before the standard error of regression, se , can be calculated, it is necessary to calculate SSyy. Enter
the value for SSyy accurate to the nearest tenth.
Expert Solution
This question has been solved!
Explore an expertly crafted, step-by-step solution for a thorough understanding of key concepts.

This is a popular solution!

Trending now
This is a popular solution!

Step by step
Solved in 2 steps with 3 images

Recommended textbooks for you
Glencoe Algebra 1, Student Edition, 9780079039897…
Algebra
ISBN:
9780079039897
Author:
Carter
Publisher:
McGraw Hill


College Algebra
Algebra
ISBN:
9781305115545
Author:
James Stewart, Lothar Redlin, Saleem Watson
Publisher:
Cengage Learning
Glencoe Algebra 1, Student Edition, 9780079039897…
Algebra
ISBN:
9780079039897
Author:
Carter
Publisher:
McGraw Hill
College Algebra
Algebra
ISBN:
9781305115545
Author:
James Stewart, Lothar Redlin, Saleem Watson
Publisher:
Cengage Learning

Functions and Change: A Modeling Approach to Coll…
Algebra
ISBN:
9781337111348
Author:
Bruce Crauder, Benny Evans, Alan Noell
Publisher:
Cengage Learning