The process of drawing conclusions about a population on the basis of measurements or observations made on a sample of individuals from the population. is a definition of O a. Parameter O b. Sample O c. Non of these d. Population e. Statistic
The process of drawing conclusions about a population on the basis of measurements or observations made on a sample of individuals from the population. is a definition of O a. Parameter O b. Sample O c. Non of these d. Population e. Statistic

Mathematics For Machine Technology
8th Edition
ISBN:9781337798310
Author:Peterson, John.
Publisher:Peterson, John.
Chapter29: Tolerance, Clearance, And Interference
Section: Chapter Questions
Problem 20A: Mating parts are shown in Figure 29-16. The pins in the top piece fit into the holes in the bottom...

Related questions
Topic Video
Question
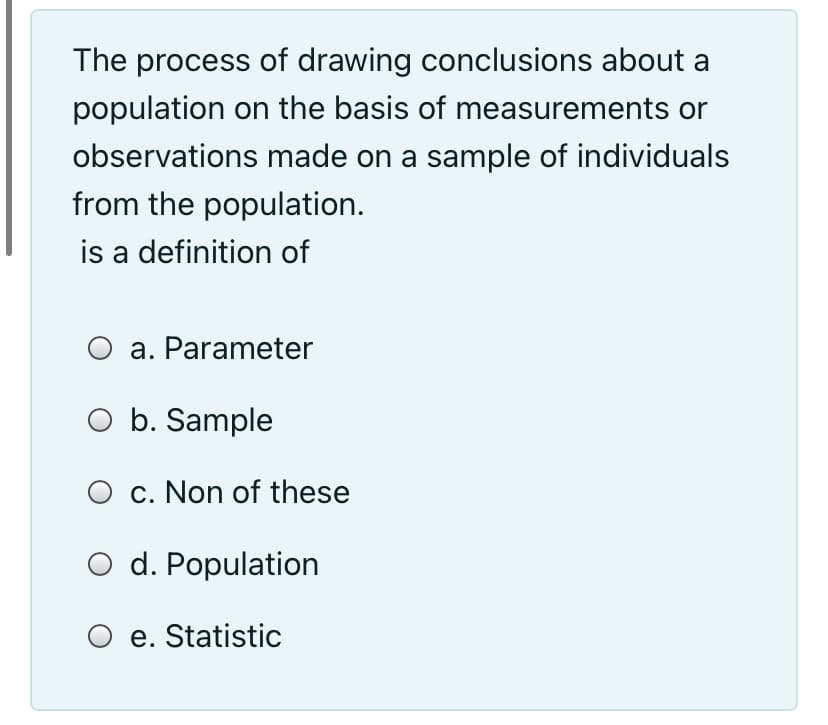
Transcribed Image Text:The process of drawing conclusions about a
population on the basis of measurements or
observations made on a sample of individuals
from the population.
is a definition of
a. Parameter
O b. Sample
c. Non of these
O d. Population
e. Statistic
Expert Solution
This question has been solved!
Explore an expertly crafted, step-by-step solution for a thorough understanding of key concepts.

Step by step
Solved in 2 steps

Knowledge Booster


Learn more about
Need a deep-dive on the concept behind this application? Look no further. Learn more about this topic, statistics and related others by exploring similar questions and additional content below.Recommended textbooks for you
Mathematics For Machine Technology
Advanced Math
ISBN:
9781337798310
Author:
Peterson, John.
Publisher:
Cengage Learning,

Elementary Geometry For College Students, 7e
Geometry
ISBN:
9781337614085
Author:
Alexander, Daniel C.; Koeberlein, Geralyn M.
Publisher:
Cengage,

Algebra & Trigonometry with Analytic Geometry
Algebra
ISBN:
9781133382119
Author:
Swokowski
Publisher:
Cengage
Mathematics For Machine Technology
Advanced Math
ISBN:
9781337798310
Author:
Peterson, John.
Publisher:
Cengage Learning,
Elementary Geometry For College Students, 7e
Geometry
ISBN:
9781337614085
Author:
Alexander, Daniel C.; Koeberlein, Geralyn M.
Publisher:
Cengage,
Algebra & Trigonometry with Analytic Geometry
Algebra
ISBN:
9781133382119
Author:
Swokowski
Publisher:
Cengage

Glencoe Algebra 1, Student Edition, 9780079039897…
Algebra
ISBN:
9780079039897
Author:
Carter
Publisher:
McGraw Hill