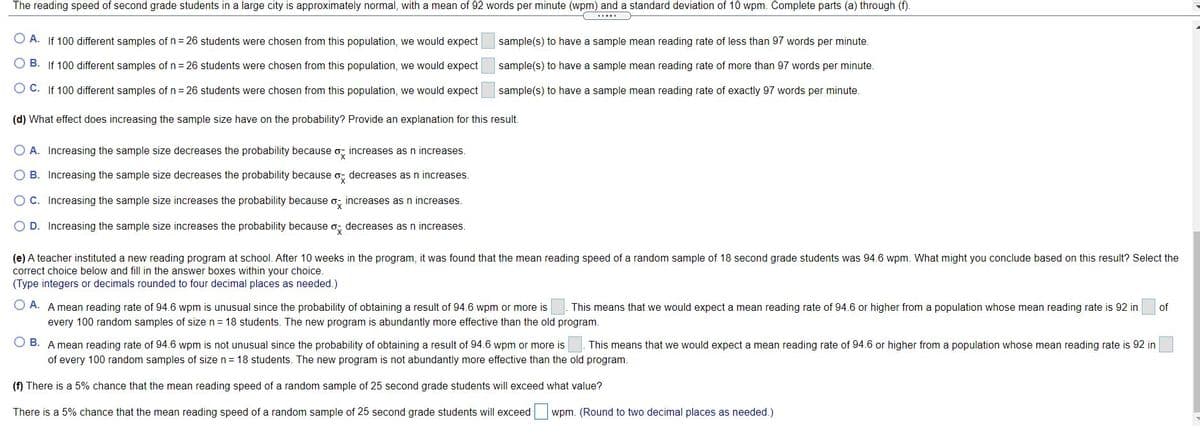
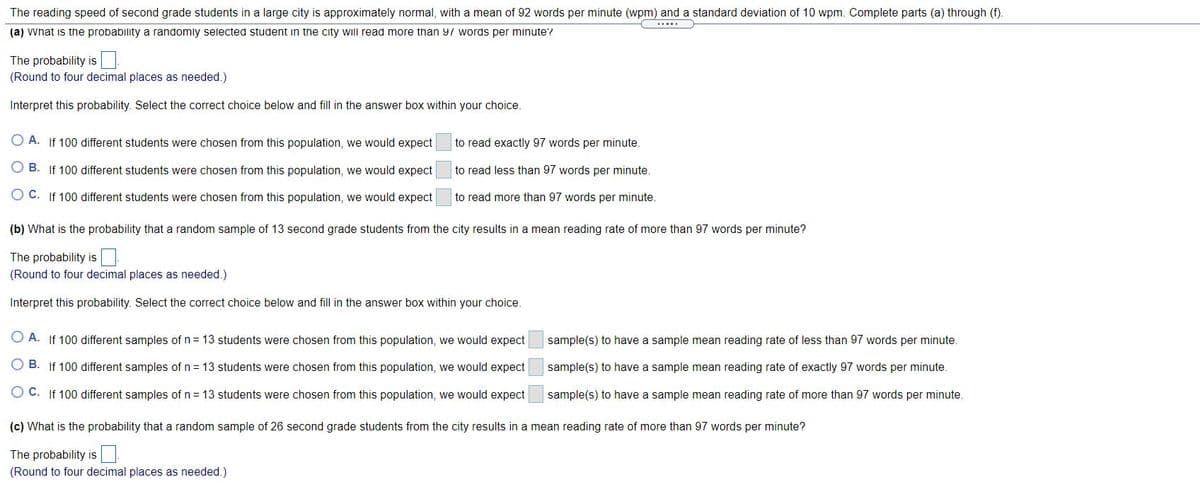
The reading speed of second grade students in a large city is approximately normal, with a mean of 92 words per minute (wpm) and a standard deviation of 10 wpm. Complete parts (a) through (f). O A. If 100 different samples of n= 26 students were chosen from this population, we would expect sample(s) to have a sample mean reading rate of less than 97 words per minute. OB. If 100 different samples of n= 26 students were chosen from this population, we would expect sample(s) to have a sample mean reading rate of more than 97 words per minute. OC. If 100 different samples of n= 26 students were chosen from this population, we would expect sample(s) to have a sample mean reading rate of exactly 97 words per minute. (d) What effect does increasing the sample size have on the probability? Provide an explanation for this result. O A. Increasing the sample size decreases the probability because o, increases as n increases. OB. Increasing the sample size decreases the probability because o; decreases as n increases. OC. Increasing the sample size increases the probability because o, increases as n increases. OD. Increasing the sample size increases the probability because o, decreases as n increases. (e) A teacher instituted a new reading program at school. After 10 weeks in the program, it was found that the mean reading speed of a random sample of 18 second grade students was 94.6 wpm. What might you conclude based on this result? Select the correct choice below and fill in the answer boxes within your choice. (Type integers or decimals rounded to four decimal places as needed ) O A. A mean reading rate of 94.6 wpm is unusual since the probability of obtaining a result of 94.6 wpm or more is every 100 random samples of size n= 18 students. The new program is abundantly more effective than the old program. This means that we would expect a mean reading rate of 94.6 or higher from a population whose mean reading rate is 92 in of OB. Amean reading rate of 94.6 wpm is not unusual since the probability of obtaining a result of 94.6 wpm or more is of every 100 random samples of size n= 18 students. The new program is not abundantly more effective than the old program. This means that we would expect a mean reading rate of 94.6 or higher from a population whose mean reading rate is 92 in [f) There is a 5% chance that the mean reading speed of a random sample of 25 second grade students will exceed what value? There is a 5% chance that the mean reading speed of a random sample of 25 second grade students will exceed wpm. (Round to two decimal places as needed.)


Unitary Method
The word “unitary” comes from the word “unit”, which means a single and complete entity. In this method, we find the value of a unit product from the given number of products, and then we solve for the other number of products.
Speed, Time, and Distance
Imagine you and 3 of your friends are planning to go to the playground at 6 in the evening. Your house is one mile away from the playground and one of your friends named Jim must start at 5 pm to reach the playground by walk. The other two friends are 3 miles away.
Profit and Loss
The amount earned or lost on the sale of one or more items is referred to as the profit or loss on that item.
Units and Measurements
Measurements and comparisons are the foundation of science and engineering. We, therefore, need rules that tell us how things are measured and compared. For these measurements and comparisons, we perform certain experiments, and we will need the experiments to set up the devices.
Standard Normal Dist. Table 1
z .00 .01 .02 .03 .04 .05 .06 .07 .08 .09
-3.4 .0003 .0003 .0003 .0003 .0003 .0003 .0003 .0003 .0003 .0002
-3.3 .0005 .0005 .0005 .0004 .0004 .0004 .0004 .0004 .0004 .0003
-3.2 .0007 .0007 .0006 .0006 .0006 .0006 .0006 .0005 .0005 .0005
-3.1 .0010 .0009 .0009 .0009 .0008 .0008 .0008 .0008 .0007 .0007
-3.0 .0013 .0013 .0013 .0012 .0012 .0011 .0011 .0011 .0010 .0010
-2.9 .0019 .0018 .0018 .0017 .0016 .0016 .0015 .0015 .0014 .0014
-2.8 .0026 .0025 .0024 .0023 .0023 .0022 .0021 .0021 .0020 .0019
-2.7 .0035 .0034 .0033 .0032 .0031 .0030 .0029 .0028 .0027 .0026
-2.6 .0047 .0045 .0044 .0043 .0041 .0040 .0039 .0038 .0037 .0036
-2.5 .0062 .0060 .0059 .0057 .0055 .0054 .0052 .0051 .0049 .0048
-2.4 .0082 .0080 .0078 .0075 .0073 .0071 .0069 .0068 .0066 .0064
-2.3 .0107 .0104 .0102 .0099 .0096 .0094 .0091 .0089 .0087 .0084
-2.2 .0139 .0136 .0132 .0129 .0125 .0122 .0119 .0116 .0113 .0110
-2.1 .0179 .0174 .0170 .0166 .0162 .0158 .0154 .0150 .0146 .0143
-2.0 .0228 .0222 .0217 .0212 .0207 .0202 .0197 .0192 .0188 .0182
-1.9 .0287 .0281 .0274 .0268 .0262 .0256 .0250 .0244 .0239 .0233
-1.8 .0359 .0351 .0344 .0336 .0329 .0322 .0314 .0307 .0301 .0294
-1.7 .0446 .0436 .0427 .0418 .0409 .0401 .0392 .0384 .0375 .0367
-1.6 .0548 .0537 .0526 .0516 .0505 .0495 .0485 .0475 .0465 .0455
-1.5 .0668 .0655 .0643 .0630 .0618 .0606 .0594 .0582 .0571 .0559
-1.4 .0808 .0793 .0778 .0764 .0749 .0735 .0721 .0708 .0694 .0681
-1.3 .0968 .0951 .0934 .0918 .0701 .0885 .0869 .0853 30838 .0823
-1.2 .1151 .1131 .1112 .1093 .1075 .1056 .1038 .1020 .1003 .0985
-1.1 .1357 .1335 .1314 .1292 .1271 .1251 .1230 .1210 .1190 .1170
-1.0 .1587 .1562 .1539 .1515 .1492 .1469 .1446 .1423 .1401 .1379
-0.9 .1841 .1814 .1788 .1762 .1736 .1711 .1685 .1660 .1635 .1611
-0.8 .2119 .2094 .2061 .2033 .2005 .1977 .1949 .1922 .1894 .1867
-0.7 .2420 .2389 .2358 .2327 .2296 .2266 .2236 .2206 .2177 .2148
-0.6 .2743 .2709 .2676 .2643 .2611 .2578 .2546 .2514 .2483 .2451
-0.5 .3085 .3050 .3015 .2981 .2947 .2912 .2877 .2843 .2810 .2776
-0.4 .3446 .3409 .3372 .3336 .3300 .3264 .3228 .3192 .3156 .3121
-0.3 .3821 .3783 .3745 .3707 .3669 .3632 .3594 .3557 .3520 .3483
-0.2 .4207 .4168 .4129 .4090 .4052 .4013 .3974 .3936 .3897 .3859
-0.1 .4602 .4562 .4522 .4483 .4443 .4404 .4364 .4325 .4286 .4247
-0.0 .5000 .4960 .4920 .4880 .4840 .4801 .4761 .4721 .4681 .4641
Standard Normal Dist. Table 2
z .00 .01 .02 .03 .04 .05 .06 .07 .08 .09
0.0 .5000 .5040 .5080 .5120 .5160 .5199 .5239 .5279 .5319 .5359
0.1 .5398 .5438 .5478 .5517 .5557 .5596 .5636 .5675 .5714 .5753
0.2 .5793 .5832 .5871 .5910 .5948 .5987 .6026 .6064 .6103 .6141
0.3 .6179 .6217 .6255 .6293 .6331 .6368 .6406 .6443 .6480 .6517
0.4 .6554 .6591 .6628 .6664 .6700 .6736 .6772 .6808 .6844 .6879
0.5 .6915 .6950 .6985 .7019 .7054 .7088 .7123 .7157 .7190 .7224
0.6 .7257 .7291 .7324 .7357 .7389 .7422 .7454 .7486 .7517 .7549
0.7 .7580 .7611 .7642 .7673 .7704 .7734 .7764 .7794 .7823 .7852
0.8 .7881 .7910 .7939 .7967 .7995 .8032 .8051 .8078 .8106 .8133
0.9 .8159 .8186 .8212 .8238 .8264 .8289 .8315 .8340 .8365 .8389
1.0 .8413 .8438 .8461 .8485 .8508 .8531 .8554 .8577 .8599 .8621
1.1 .8643 .8665 .8686 .8708 .8729 .8749 .8770 .8790 .8810 .8830
1.2 .8849 .8869 .8888 .8907 .8925 .8944 .8962 .8980 .8997 .9015
1.3 .9032 .9049 .9066 .9082 .9099 .9115 .9131 .9147 .9162 .9177
1.4 .9192 .9207 .9222 .9236 .9251 .9265 .9279 .9292 .9306 .9319
1.5 .9332 .9345 .9357 .9370 .9382 .9394 .9406 .9418 .9429 .9441
1.6 .9452 .9463 .9474 .9484 .9495 .9505 .9515 .9525 .9535 .9545
1.7 .9554 .9564 .9573 .9582 .9591 .9599 .9608 .9616 .9625 .9633
1.8 .9641 .9649 .9656 .9664 .9671 .9678 .9686 .9693 .9699 .9706
1.9 .9713 .9719 .9726 .9732 .9738 .9744 .9750 .9756 .9761 .9767
2.0 .9772 .9778 .9783 .9788 .9793 .9798 .9803 .9808 .9812 .9817
2.1 .9821 .9826 .9830 .9834 .9838 .9842 .9846 .9850 .9854 .9857
2.2 .9861 .9864 .9868 .9871 .9875 .9878 .9881 .9884 .9887 .9890
2.3 .9893 .9896 .9898 .9901 .9904 .9906 .9909 .9911 .9913 .9916
2.4 .9918 .9920 .9922 .9925 .9927 .9929 .9931 .9932 .9934 .9936
2.5 .9938 .9940 .9941 .9943 .9945 .9946 .9948 .9949 .9951 .9952
2.6 .9953 .9955 .9956 .9957 .9959 .9960 .9961 .9962 .9963 .9964
2.7 .9965 .9966 .9967 .9968 .9969 .9970 .9971 .9972 .9973 .9974
2.8 .9974 .9975 .9976 .9977 .9977 .9978 .9979 .9979 .9980 .9981
2.9 .9981 .9982 .9982 .9983 .9984 .9984 .9985 .9985 .9986 .9986
3.0 .9987 .9987 .9987 .9988 .9988 .9989 .9989 .9989 .9990 .9990
3.1 .9990 .9991 .9991 .9991 .9992 .9992 .9992 .9992 .9993 .9993
3.2 .9993 .9993 .9994 .9994 .9994 .9994 .9994 .9995 .9995 .9995
3.3 .9995 .9995 .9995 .9996 .9996 .9996 .9996 .9996 .9996 .9997
3.4 .9997 .9997 .9997 .9997 .9997 .9997 .9997 .9997 .9997 .9998


Trending now
This is a popular solution!

Step by step
Solved in 2 steps with 4 images


